Concept
Speed Resistance Lines
Speed Resistance Lines, also known as quadrant lines, are Trend concepts. The Library holds 1 implementation, a working definition you can pull into Quant.
Top Speed Resistance Lines indicator
The top custom implementation, built on the original standard Speed Resistance Lines formula.
1 total
This Speed Resistance Lines implementation is strategy-ready: open it in Quant, set your rules, and it backtests automatically.
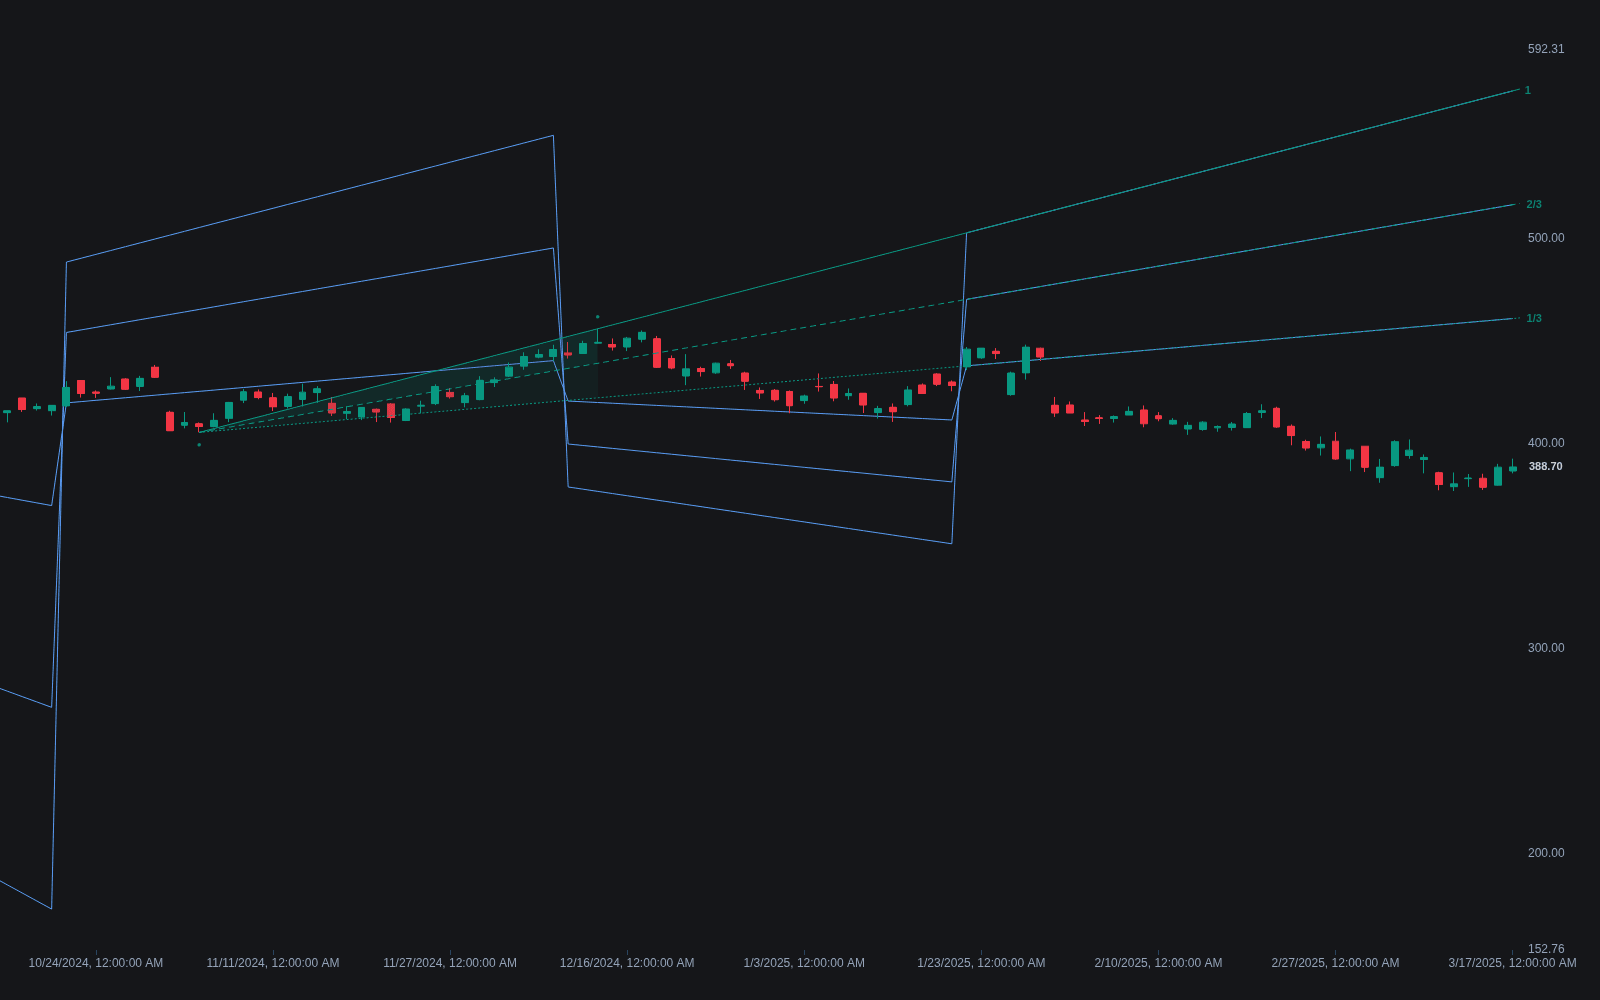
What are Speed Resistance Lines?
Speed resistance lines, or speedlines, are a fan tool credited to market analyst Edson Gould. In an uptrend, the vertical rise from a significant swing low to a swing high is divided into thirds; from the same low, one ray is drawn through the two-thirds level and another through the one-third level measured at the high's position. Together with the original low-to-high line, that gives three rays of decreasing slope: the trend's full speed and two slower fractions of it. The construction mirrors downward from a high in a downtrend.
The lines act as trend-speed benchmarks. A correction that holds the 2/3 speedline keeps most of the advance's pace intact; losing it shifts attention to the 1/3 line, and breaking both suggests the trend's rate has failed even if price still sits above the swing low. The name quadrant lines, sometimes grouped with speedlines, refers to a related construction that splits the same swing into fourths rather than thirds. As with any anchored geometry, the levels depend entirely on which swing points are chosen, and reactions at them are tendencies, not guarantees.
Gould himself is a name worth knowing: one of the most followed technicians of the mid-twentieth century, whose advisory work made celebrated multi-decade calls and whose three-steps-and-a-stumble rule about monetary policy entered the permanent vocabulary. The speedline idea translates the classical one-third and two-thirds correction depths into sloped form: instead of asking how much of the rise was retraced, it asks whether the trend still advances at a third or two-thirds of its original rate, converting a static retracement grid into rays that rise with time. The logic is why the 2/3 line carries the primary defense role, since a trend that keeps two-thirds of its speed is merely resting.
The modern descendants swap the fractions: fib speed resistance fans, the auto-anchored builds among them, draw the same rays through 0.382, 0.5 and 0.618 of the swing instead of thirds, merging Gould's geometry with the retracement family's numbers. Practice is anchor discipline plus confluence: the fan means most when drawn from swings the market demonstrably respected, its levels gain force where they cross horizontal structure, and a broken speedline retested from beneath is played with ordinary trendline role-reversal logic. The standing caveat is the family's: anchored geometry is only as objective as the anchors.
How to identify speed resistance lines
One swing, three rays: the construction is arithmetic, the meaning is the defense ladder.
- 1Anchor on a significant swing: a low and the high it produced in an uptrend, the mirror in a downtrend.
- 2Divide the vertical rise into thirds, marking the one-third and two-thirds heights at the swing high's position in time.
- 3Draw the rays from the anchor low through each fraction: full-speed line to the high, then the 2/3 and 1/3 speedlines beneath it.
- 4Extend the rays forward: they rise with time, expressing correction depth as trend rate rather than static levels.
- 5Read the ladder: corrections holding the 2/3 line keep the trend's pace; losing it demotes attention to the 1/3 line; breaking both says the rate has failed regardless of price's level.
How traders use it
- As trailing trend gauges in an established move: the 2/3 line is watched as the first defense during pullbacks, then the 1/3 line, with each loss treated as a downgrade of trend strength rather than an instant reversal call.
- As a sloped alternative to one-third and two-thirds retracement rules: the speedline version expresses those correction depths as support that rises (or falls) with time instead of static horizontal levels.
- As a role-reversal frame: a broken speedline is watched as resistance on the retest, the same logic applied to an ordinary trendline.
- In fib-fraction form: auto-anchored fan tools draw the same rays through 0.382, 0.5 and 0.618 of the swing, blending Gould's construction with the retracement family's levels for traders who prefer those numbers.
- With confluence discipline: speedline touches that coincide with horizontal levels, prior structure, or a dynamic average get the attention, while lone geometric touches in space are logged rather than traded.
Speedlines vs related fan and line tools
Gann Fan: Both fan rays from a pivot, but speedlines scale to the measured swing, thirds of its actual rise, while Gann angles assert fixed price-time slopes independent of any swing and sensitive to chart scaling. Swing-relative versus absolute geometry is the entire dispute.
Trendline: A trendline is drawn to touches, earning its slope from the market's own pivots; a speedline's slope is computed from one swing's arithmetic, touches optional. The trendline is evidence-fitted, the speedline hypothesis-projected, which is why the latter needs confluence to earn trust.
Dynamic S/R via MA: Moving averages supply sloped support computed continuously from all recent prices; speedlines supply it from two anchor points and fixed fractions. The average adapts and lags, the fan is fixed and instant, and trends that respect one often ignore the other.
Concept family
Trend
100 concepts mapped · 100 in the Library
Speed Resistance Lines FAQ
Turn Speed Resistance Lines into a trading strategy.
Take the implementation from this page into Quant, then build on it, backtest it on real data, and keep refining it in conversation.