Quarterly Theory
Quarterly Theory is a Smart Money Concepts / ICT concept. The Library holds 1 implementation, a working definition you can pull into Quant.
session quarters / 90-minute cycles
Top Quarterly Theory indicator
The top custom implementation, built on the original standard Quarterly Theory formula.
1 total
This Quarterly Theory implementation is strategy-ready: open it in Quant, set your rules, and it backtests automatically.
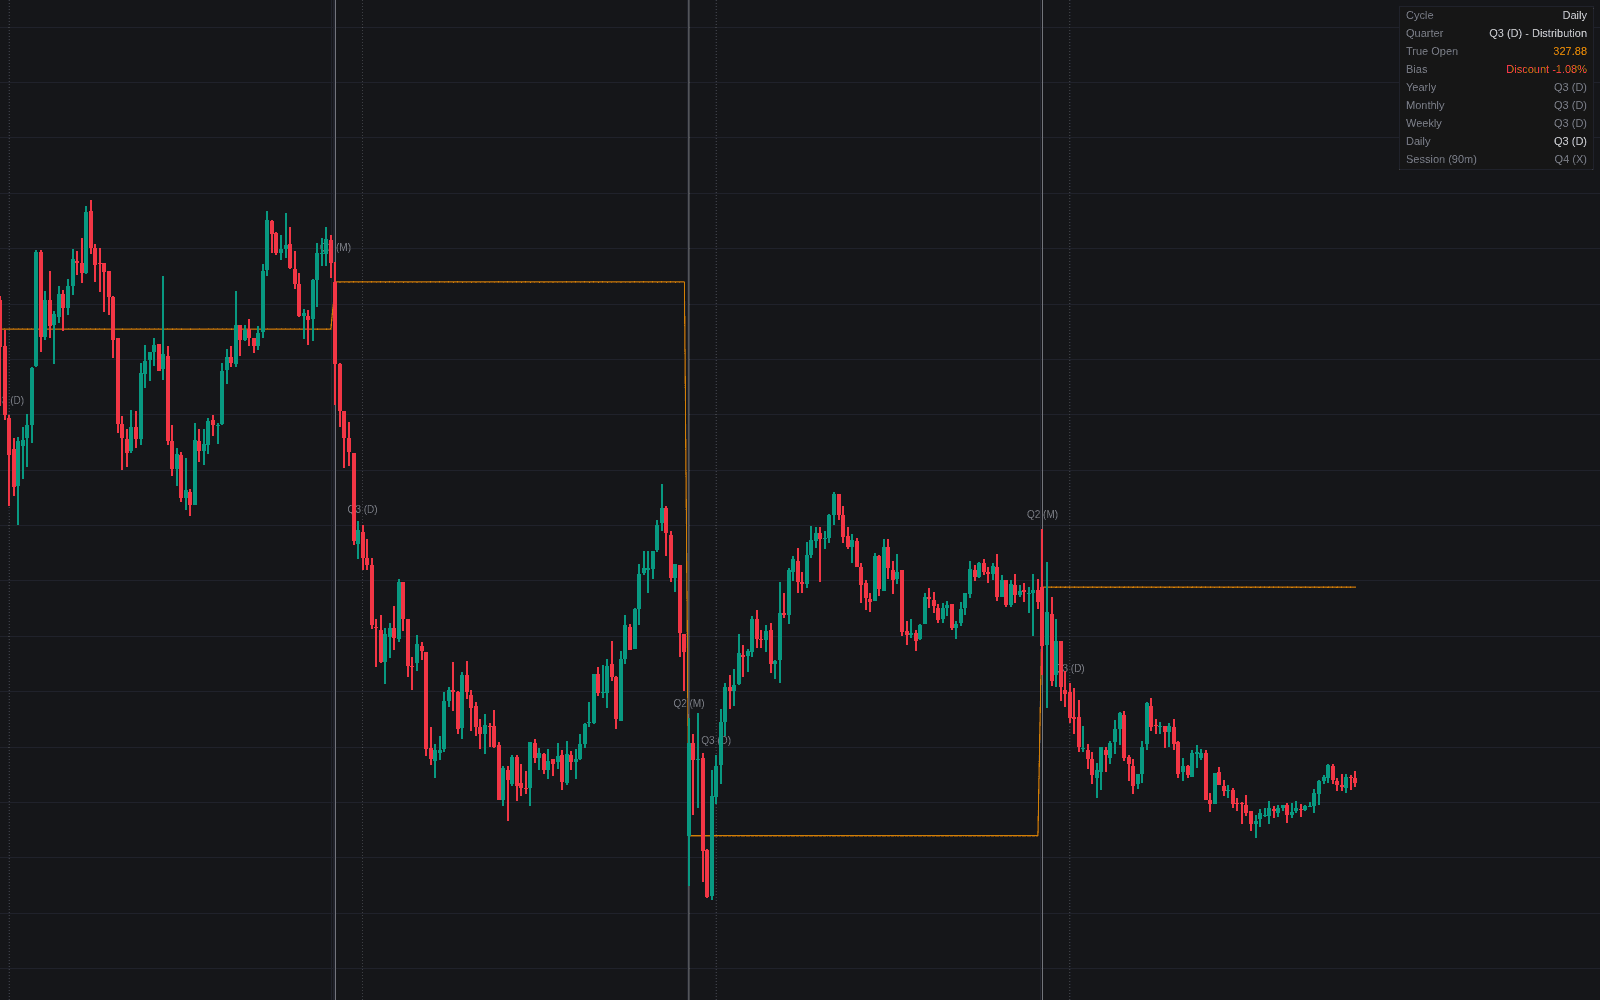
What is Quarterly Theory?
Quarterly Theory divides every trading cycle into four quarters and gives each a role. In New York time the day splits into four six-hour quarters: Asia (6:00 pm–12:00 am), London (12:00–6:00 am), New York (6:00 am–12:00 pm) and the afternoon (12:00–6:00 pm); each session subdivides into four 90-minute quarters, and the same grid extends up to the week, month and year. Each cycle is expected to unfold as accumulation, manipulation, distribution, then continuation or reversal: AMDX, or the shifted ordering XAMD when delivery front-runs the cycle.
The framework is most closely associated with the trader known as Daye, who assembled it in the early 2020s from the time-based teachings of the Inner Circle Trader (ICT), whose material supplies the ingredients, from killzones to the midnight open and other ICT time anchors. What Quarterly Theory adds to its sources is recursion: the same four-phase template applied at every scale, from the year down to the 90-minute quarters and below.
The working reference is each cycle's 'true open': the open of its second quarter rather than the calendar open, midnight New York in the daily case. Analogous anchors are cited for the larger cycles, Monday evening for the week, the first Monday of April for the year, though sources differ on the exact list. Q1 defines a range, manipulation is anticipated around the true open, and the real delivery is expected after it. Practitioners also read price against the true open as premium or discount, so the level doubles as a bias line.
The appeal is an expected ordering for familiar events: a liquidity sweep through a prior low is no longer just a sweep, it is anticipated at a particular quarter of a particular session. The framework extends killzone-style session logic into a self-similar grid, its details are contested across sources, and the grid has no independent statistical validation, so treat it as a discretionary map of how delivery often unfolds, not a timetable the market must keep.
How to identify the quarters on a chart
The grid is fixed New York clock times, so identification is mostly careful session marking.
- 1Set the chart's timezone to New York; every boundary is defined there, and exchange-local or UTC charts misplace the quarters.
- 2Divide the day at 6:00 pm, 12:00 am, 6:00 am and 12:00 pm, then split any session of interest into its four 90-minute quarters.
- 3Mark the true open, midnight for the daily cycle, and label Q1's high and low; manipulation is expected to run one side of that range near the true open before the directional leg.
- 4Watch Q2 and Q3 for the sweep-and-reverse: a raid through Q1's range or session liquidity that fails and closes back inside is the manipulation signature.
How traders use it
- To time entries inside a session: if a session's first 90-minute quarter builds a range and the second runs one side of it (a Judas swing in session terms), the trader looks for the distribution leg in the opposite direction during the third quarter, positioning with the anticipated phase instead of chasing the run.
- To frame bias across scales: the quarter of the year or month colors the expectation for the week, and the weekly quarter colors the day, so the working question before any intraday signal is 'which quarter am I in, and what phase should this be?'
- To spot manipulation at true opens: a raid through a cycle's true open that fails and closes back through it is read as the manipulation leg completing, and becomes the trigger to position for the distribution that should follow.
- To refine entries: once the manipulation leg is identified, traders drop to a lower timeframe for a fair value gap, an order block or an optimal trade entry retracement in the distribution direction.
- To project targets: some practitioners extend standard-deviation projections of the manipulation leg as objectives for the distribution quarter.
Quarterly Theory vs neighboring ICT concepts
ICT Time Anchors: Time anchors are individual clock references: the midnight open, session opens, news times. Quarterly Theory strings them into a cycle grammar, assigning each interval a phase role rather than treating anchors as isolated points.
ICT Session Ranges: Session-range analysis treats each session's high, low and behavior as one unit. Quarterly Theory subdivides the same sessions into quarters with distinct jobs, a London range becoming four 90-minute phases rather than one block.
Accumulation-manipulation-distribution: AMD describes the phase sequence itself; Quarterly Theory is one scheme for when each phase should occur, pinning AMD onto fixed clock quarters at every scale and appending an X phase for continuation or reversal.
Concept family
Smart Money Concepts / ICT
55 concepts mapped · 55 in the Library
Quarterly Theory FAQ
Turn Quarterly Theory into a trading strategy.
Take the implementation from this page into Quant, then build on it, backtest it on real data, and keep refining it in conversation.