Central Pivot Range
Central Pivot Range, also known as width analysis, virgin CPR, is a Support/Resistance & Levels concept. The Library holds 1 implementation, a working definition you can pull into Quant.
CPR
Top Central Pivot Range indicator
The top custom implementation, built on the original standard Central Pivot Range formula.
1 total
Want to trade Central Pivot Range? The implementation below is one prompt away from a backtested strategy in Quant.
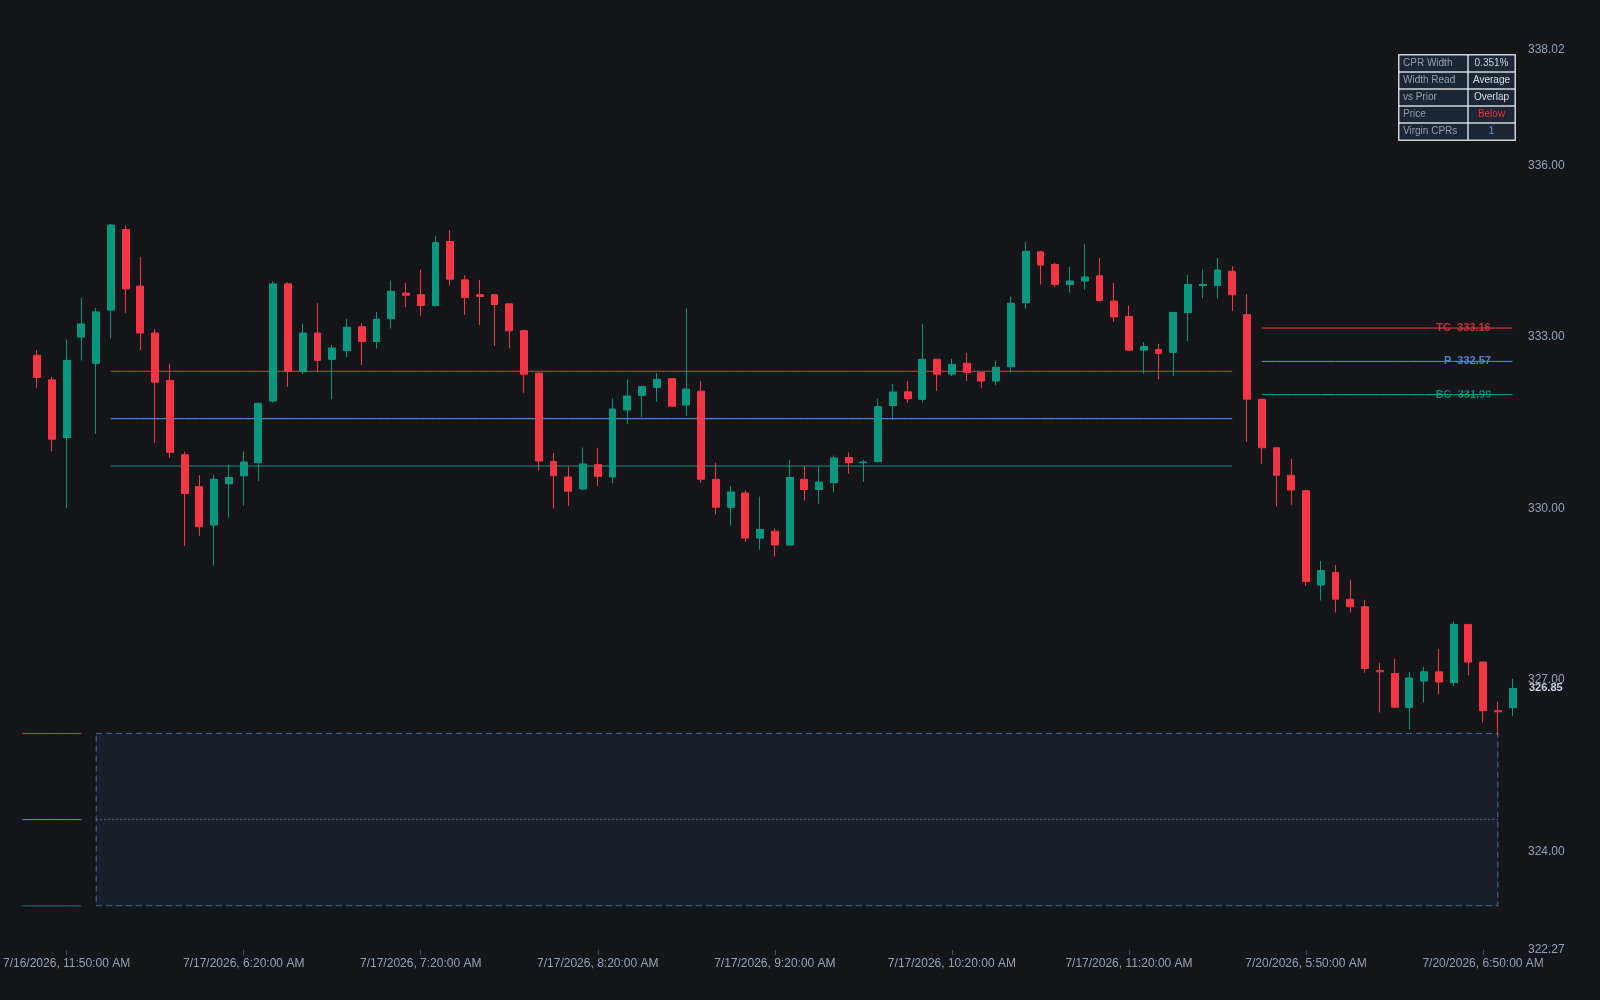
What is the Central Pivot Range?
The central pivot range (CPR) is a three-line pivot construct computed from the prior period's high, low, and close. The central pivot is the familiar (high + low + close) / 3; the bottom central line is the range midpoint, (high + low) / 2; the top central line mirrors it on the other side, (2 × pivot) - bottom central, so the pivot sits exactly halfway between the two. Plotted across the following session, the band frames the prior period's consensus area, a formula-based cousin of the volume profile's value area.
The construct builds on floor pivots and was popularized in pivot-trading literature largely for its width analysis. The width works out to two-thirds of the distance between the prior close and the prior range midpoint, so a narrow CPR marks a session that closed near the middle of its range (balance, indecision) and a wide CPR one that closed near an extreme (directional drive). The common reading follows from that: narrow CPRs are watched for breakout or trend days ahead, wide CPRs for rotation, as tendencies rather than guarantees. A virgin CPR, one price never touched during its own session, is kept plotted forward as an untested reference.
How to calculate the Central Pivot Range
One prior period supplies every input; the prior day is the standard choice for intraday use.
- 1Take the prior period's high (H), low (L), and close (C).
- 2Compute the pivot: P = (H + L + C) / 3, the same central pivot used by floor traders.
- 3Compute the pair around it: bottom central = (H + L) / 2 and top central = (2 × P) - bottom central. When the close finished below the range midpoint the two swap, so platforms simply draw the higher value on top.
- 4Plot all three lines across the new session and compare the width, top minus bottom, against recent sessions to classify it as narrow or wide.
How it's calculated
Three pivot lines built from the prior session's high, low, and close that frame the coming session's central range.
Popularized by Frank Ochoa; a CPR that is narrow relative to recent sessions is read as favoring a trending day, a wide one as favoring rotation.
Virgin CPRs, those never traded through during their own session, are tracked afterward as support and resistance.
How traders use it
- Width analysis: a notably narrow CPR flags a balanced prior session and puts traders on alert for expansion; a wide CPR follows a directional session and sets expectations for rotation. Both are tendencies to prepare for, not outcomes to assume.
- Intraday bias: sustained trade above the range reads bullish, below reads bearish, and time spent inside it is treated as balance, where traders more often look to fade the band's edges than to chase.
- Two-day relationships: today's CPR printing entirely above yesterday's supports a continuation lean, entirely below the reverse, and heavy overlap suggests a developing trading range.
- Virgin CPRs: ranges price never entered on their own day are tracked as future references, on the logic that untested consensus areas may matter later. Nothing obliges price to return or to react.
Central Pivot Range vs related constructs
Floor Pivots: Floor pivots project a ladder of R1 to R3 and S1 to S3 around the pivot; the CPR keeps only the pivot and its midpoint pair and adds width analysis. Same inputs, different emphasis: a level ladder versus a day-type read.
Value Area: Both frame a prior session's fair-price region. The value area is built from the actual volume distribution, commonly 70% of volume around the point of control; the CPR approximates a consensus zone from three prices with no volume input.
Initial Balance: The initial balance is the current session's first-hour range, unknown until after the open. The CPR is known before the session starts, computed entirely from the prior period.
Concept family
Support/Resistance & Levels
37 concepts mapped · 37 in the Library
Central Pivot Range FAQ
Turn Central Pivot Range into a trading strategy.
Take the implementation from this page into Quant, then build on it, backtest it on real data, and keep refining it in conversation.