Concept
Bollinger Band Tag Reversion
Bollinger Band Tag Reversion is a Volatility concept. The Library holds 1 implementation, a working definition you can pull into Quant.
Top Bollinger Band Tag Reversion indicator
The top custom implementation, built on the original standard Bollinger Band Tag Reversion formula.
1 total
This Bollinger Band Tag Reversion implementation is strategy-ready: open it in Quant, set your rules, and it backtests automatically.
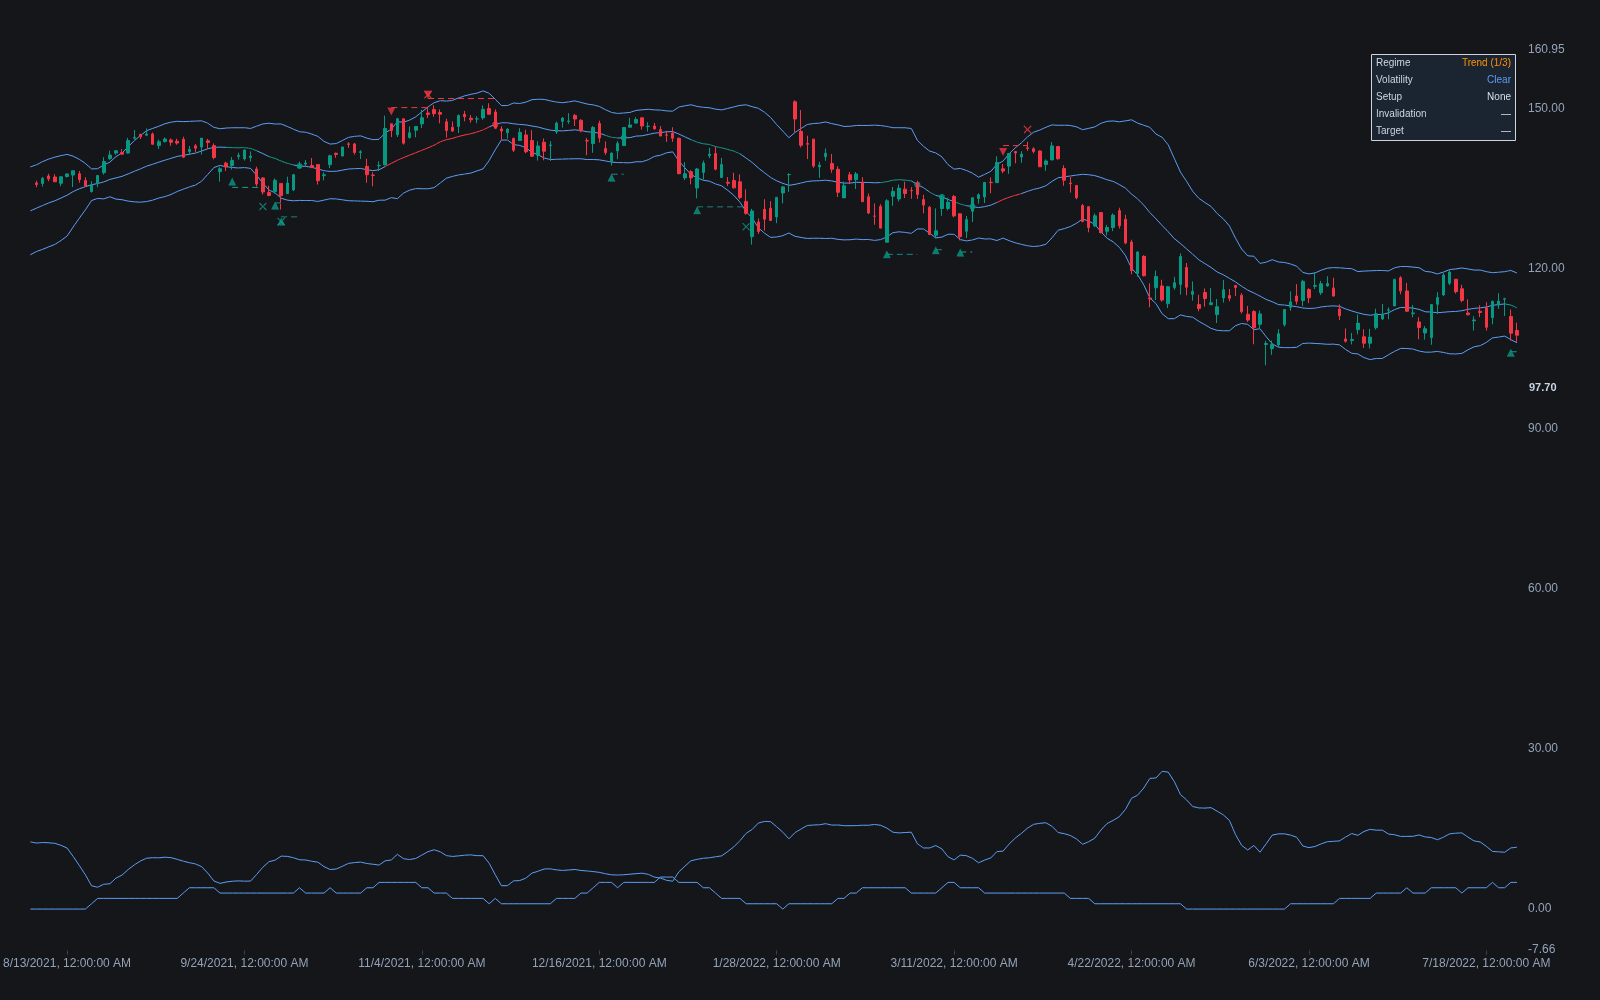
What is a Bollinger Band Tag Reversion?
A Bollinger Band tag reversion is a mean-reversion setup: price touches or pierces one of the outer Bollinger Bands (by default two standard deviations from a 20-period average) and the trade bets on a rotation back toward the middle band. The logic is statistical stretch: a tag marks price at the edge of its recent distribution, and in quiet, range-bound conditions that edge often behaves like a soft boundary rather than a doorway.
The bands themselves date to the early 1980s, when John Bollinger replaced the fixed-percentage envelopes then in common use with bands scaled by standard deviation, so band width adapts to volatility instead of staying constant. Fading band tags became one of the tool's two canonical uses, the mirror image of the breakout style that trades a Bollinger Squeeze. In Bollinger on Bollinger Bands (2001) he treats tags as raw material for setups, never as signals in themselves.
That caution is the heart of the concept: a tag of the upper band is not by itself a sell signal, and a tag of the lower band is not by itself a buy signal. In trends, price can walk the band, tagging it repeatedly while the move continues. Reversion traders therefore qualify tags with regime and confirmation: a non-trending backdrop, a close back inside the bands, a rejection candle such as a pin bar, or an oscillator reading like %B turning back from an extreme.
The statistical framing deserves honesty. Two standard deviations of a 20-period sample sounds precise, but returns are not normally distributed and the sample is small, so no fixed probability attaches to a tag. What a tag reliably says is that price is stretched relative to its own recent volatility; whether stretch mean-reverts is a regime question, which is why the setup's edge lives in the filter more than in the touch.
How to identify a Bollinger Band tag reversion setup
The setup is a sequence, not a single touch:
- 1Plot Bollinger Bands at the defaults, a 20-period average with bands two standard deviations away, and classify the regime first: rotation back and forth across the middle band suggests a range, persistent one-sided closes suggest a trend.
- 2Wait for a tag: price touching or piercing an outer band, equivalent to %B reaching 1 or above, or 0 or below.
- 3Demand confirmation, such as a close back inside the bands, a clear rejection candle at the extreme, or an oscillator turning back from its extreme.
- 4Check the volatility backdrop with BandWidth: tags that occur as the bands expand out of a tight base are breakout behavior, the worst environment for fading.
- 5Define the trade: entry on the confirming close, stop beyond the tag extreme, first target at the middle band.
How it's calculated
A mean-reversion setup where price tags the upper or lower Bollinger Band and is traded back toward the middle band.
Bollinger's convention is that a tag alone is not a signal; the setup pairs the tag with a confirming trigger such as a reversal bar or an indicator non-confirmation.
Population standard deviation (divide by n) is the standard band implementation; some versions define the tag with the high or low touching the band instead of the close.
In strong trends price can walk along a band, producing repeated tags without reversion.
How traders use it
- As a range fade: when a chop or trend filter says the market is not trending, a tag of the lower band followed by a close back inside it sets up a long toward the middle band, with the mirror-image short at the upper band.
- As a target framework: the middle band (the 20-period average by default) is the conservative reversion target, while the opposite band is the stretch target, generally reserved for well-established ranges.
- As a filter on other signals: some systems decline fresh entries in the direction of a move that is already tagging an outer band, on the grounds that price is stretched, and wait for a pullback instead.
- As a squeeze exclusion: tags that coincide with a TTM Squeeze release or a sharp BandWidth expansion are treated as the start of a move rather than a stretch, so reversion traders stand aside and let breakout traders have it.
- As a risk template: because band distance already scales with volatility, many traders set stops an ATR fraction beyond the tag extreme so normal overshoot does not knock out an otherwise valid fade, and some grade the stretch with double Bollinger zones before committing.
Bollinger Band tag reversion vs. related setups
%B: %B restates price's position between the bands as a number, above 1 on an upper tag and below 0 on a lower one. The tag reversion is a setup built on that reading; %B is the measurement that makes tags screenable and comparable.
Bollinger Squeeze: The squeeze trades volatility contraction expecting expansion, a breakout premise. Tag reversion trades stretch expecting rotation, a mean-reversion premise; they are opposite uses of the same bands, separated by regime.
Keltner Channels: Keltner Channels build the envelope from ATR around an EMA, producing smoother bands that price tags more often. Fades off either can work, but standard-deviation bands react faster to volatility bursts, so a tag means a different degree of stretch.
Concept family
Volatility
57 concepts mapped · 57 in the Library
Bollinger Band Tag Reversion FAQ
Turn Bollinger Band Tag Reversion into a trading strategy.
Take the implementation from this page into Quant, then build on it, backtest it on real data, and keep refining it in conversation.