Concept
Double Bollinger Zones
Double Bollinger Zones are Volatility concepts. The Library holds 1 implementation, a working definition you can pull into Quant.
Top Double Bollinger Zones indicator
The top custom implementation, built on the original standard Double Bollinger Zones formula.
1 total
The Double Bollinger Zones implementation below can become a backtested trading strategy — describe your rules and Quant writes the code.
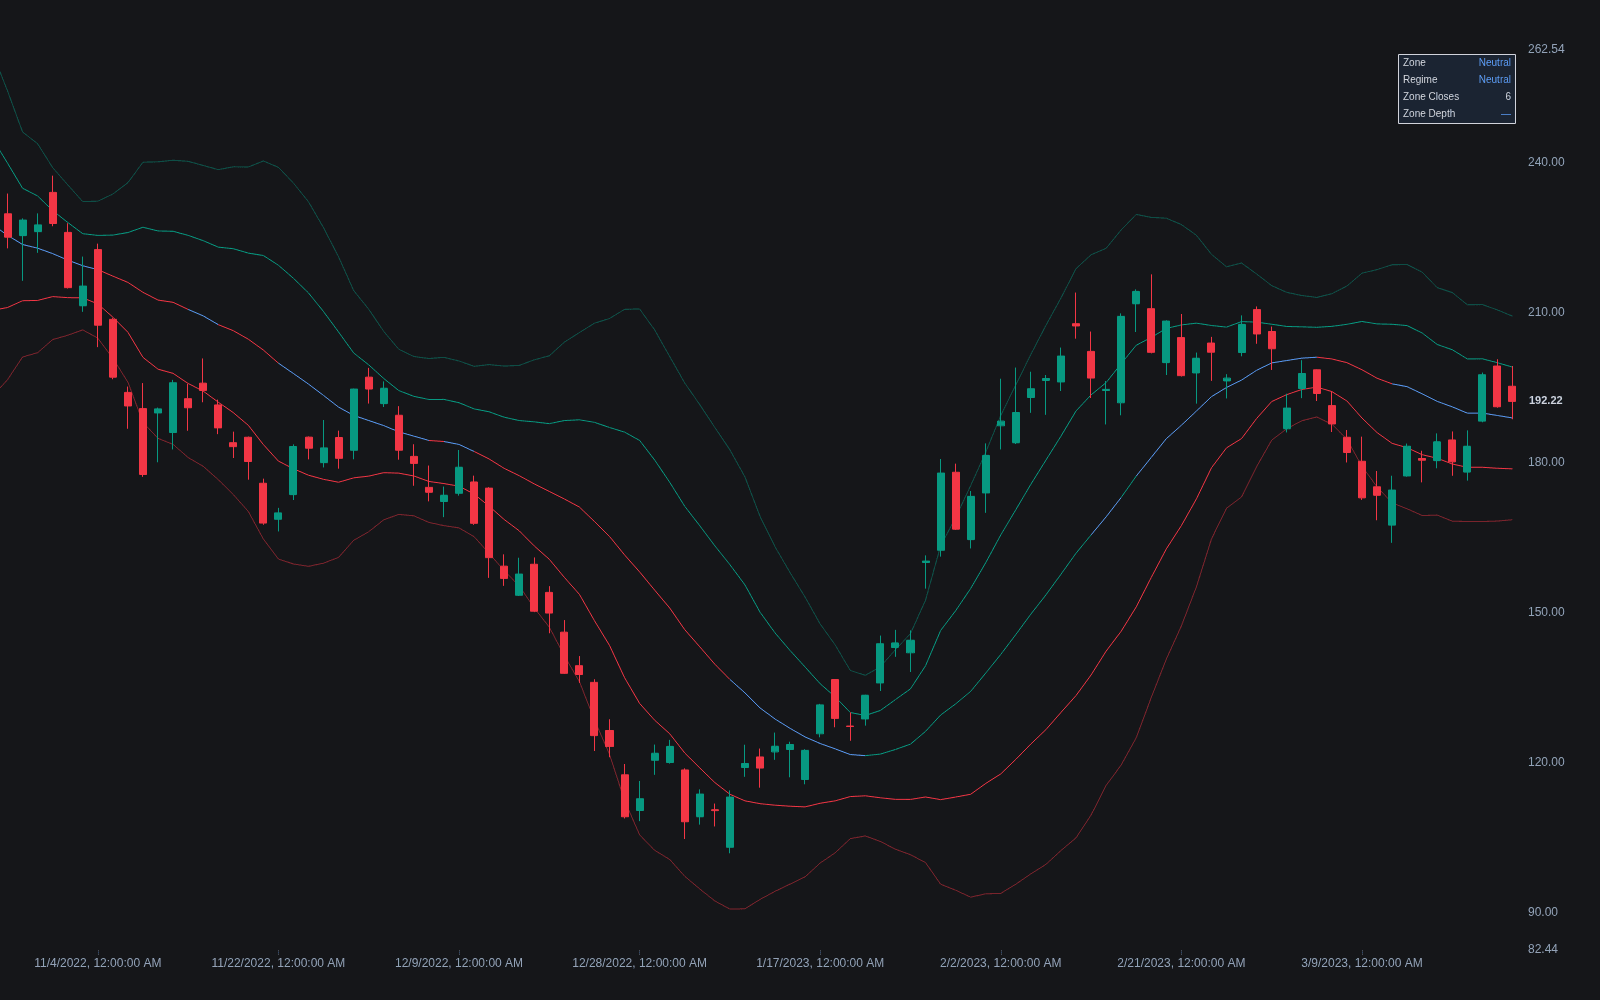
What are Double Bollinger Zones?
Double Bollinger Zones come from running two sets of Bollinger Bands on the same basis, one pair at one standard deviation and one at two, typically around a 20-period SMA. The four lines partition the chart into zones: a buy zone between the upper one- and two-deviation bands, a sell zone between the lower pair, and a neutral zone spanning everything within one deviation of the basis. Kathy Lien popularized the setup in forex trading as the Double Bollinger Band method.
Lien's currency-trading books made the technique a retail FX staple, and its design intent is worth stating: ordinary band reading treats the outer bands as stretch to fade, which fails exactly when a trend begins. Adding the inner one-deviation pair creates a diagnostic middle ground, letting the same four lines say 'fade this' inside the neutral zone and 'follow this' once price takes residence beyond one deviation.
The zones turn bands from a reversion tool into a regime map. Price that closes and holds inside the upper zone is staying more than one deviation above its own mean, something ordinary oscillation rarely sustains; the same logic marks the lower zone as downtrend territory and the neutral zone as balance, where no directional edge is claimed. The read is deliberately trend-following, which is also its cost: zone entries concede the early part of a turn, and in choppy tape price can whipsaw across the one-deviation line repeatedly.
The statistical intuition is simple: under rough normality, price spends most of its time within one deviation of its mean, so sustained residence beyond it is evidence of drift rather than noise. The practical guards follow from the same statistics: demand consecutive closes (not wicks) for zone status, expect whipsaw at the zone floor in compressed conditions, and read the zones alongside the volatility cycle, since a squeeze makes the whole geometry narrow and zone crossings cheap.
How to read Double Bollinger Zones
The four lines are a regime map; the reading is residence, not touches.
- 1Plot both band pairs on one basis: a 20-period SMA with one- and two-deviation envelopes is the standard construction.
- 2Classify by closes: consecutive closes inside the upper zone qualify the uptrend regime, inside the lower zone the downtrend, and between the inner bands neutrality.
- 3Trade the regime, not the tag: zone residence licenses trend tactics; outer-band touches inside the neutral regime remain ordinary stretch.
- 4Use the zone floor as the trend's reference: pullbacks that hold the upper one-deviation band keep the up-regime intact, and its loss is the first warning.
- 5Mind the volatility cycle: during squeezes the zones compress and crossings lose meaning, so regime claims wait for the bands to breathe again.
- 6Watch full traverses: a march from one outer zone through neutral into the other is the map's picture of a completed regime change.
How it's calculated
Two Bollinger Band pairs around one basis that divide the chart into a buy zone, a sell zone, and a neutral zone.
Popularized by Kathy Lien as Double Bollinger Bands, with multipliers 1 and 2 around a 20-period SMA.
Closes holding inside the upper zone are read as trend-continuation long territory, the lower zone as short territory, and the space between the inner bands as neutral.
Both band pairs share the same middle line and standard deviation.
How traders use it
- Trend qualification: consecutive closes inside the buy zone qualify long, trend-following entries; closes inside the sell zone qualify shorts; the neutral zone means stand aside or switch to range tactics.
- Pullback entries: in an established uptrend, a pullback that holds the upper one-deviation band, the floor of the buy zone, offers a continuation entry with the invalidation sitting just below.
- Exit and flip cues: a close back into the neutral zone warns that the trend's grip is loosening, and a full traverse into the opposite zone describes a completed shift in regime.
- Range tactics: while price lives in the neutral zone, classic band behavior applies, and traders fade pushes toward the outer bands as trading range rotations rather than chase them.
- As a scan condition: zone state (which zone, how many closes, distance from the zone floor) screens a universe for established trends and fresh regime changes, with BandWidth alongside to exclude squeeze conditions where the zones are too narrow to mean anything.
Double Bollinger Zones vs. related tools
Bollinger Bands: A single band pair is most often read for reversion, with tags of the extremes treated as stretch. The double setup adds the one-deviation pair precisely to identify when tags are trend rather than stretch, and should be followed instead of faded.
%B: %B expresses the same information continuously: with two-deviation outer bands, readings above 0.75 correspond to the buy zone and below 0.25 to the sell zone. The zones discretize what %B measures; %B suits scanning and coding, zones suit visual reading.
Fibonacci Bollinger Bands: The Fibonacci variant subdivides one wide envelope into ratio rungs used as support and resistance. Double Bollinger Zones use two sigma tiers to classify regime; one is a ladder of levels, the other a map of trend states.
Concept family
Volatility
57 concepts mapped · 57 in the Library
Double Bollinger Zones FAQ
Turn Double Bollinger Zones into a trading strategy.
Take the implementation from this page into Quant, then build on it, backtest it on real data, and keep refining it in conversation.