Concept
Envelope
Envelope is a Volatility concept. The Library holds 3 implementations, each one a working definition you can pull into Quant.
percent
Top Envelope indicators
The top custom implementations, built on the original standard Envelope formula.
3 total
Any of the 3 Envelope implementations below can become a backtested trading strategy — describe your rules and Quant writes the code.
.png&w=3840&q=75)
What is an Envelope?
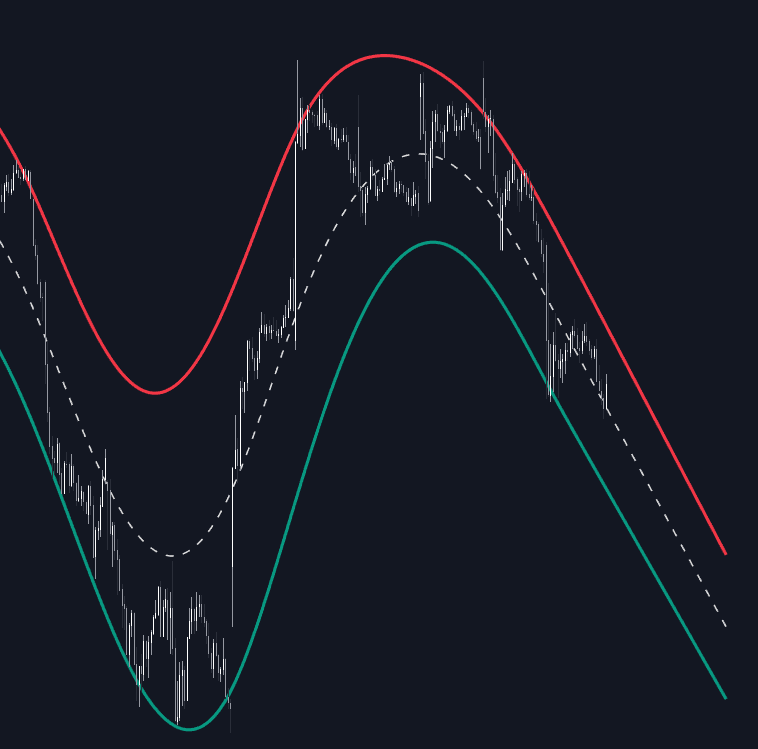
An envelope is a pair of boundary lines offset symmetrically above and below a baseline, most commonly a moving average shifted up and down by a fixed percentage: upper = baseline × (1 + p), lower = baseline × (1 - p). Unlike Bollinger Bands or Keltner Channels, whose width breathes with measured volatility, a percentage envelope holds its relative width constant until the trader changes it. The classic case, a simple or exponential average with percent offsets, is often labeled an MA Envelope; the broader envelope idea also covers fixed offsets around other baselines such as regression fits or kernel smoothers.
Envelopes are among the older band constructions in technical analysis. Percentage bands around moving averages circulated in trading literature by the 1960s, and J.M. Hurst's 1970 book The Profit Magic of Stock Transaction Timing built a cycle methodology on constant-width envelopes around smoothed price. John Bollinger's standard-deviation bands came decades later; the fixed envelope is the ancestor of the adaptive band family.
The fixed offset is both the appeal and the burden. It gives a stable, easily interpreted definition of stretched: price beyond the band is further from the baseline than the chosen tolerance, full stop. But the right tolerance is instrument- and timeframe-specific, since a 2% band that contains nearly every daily close on a quiet large-cap stock would be crossed constantly on a volatile crypto pair. Envelopes therefore need periodic recalibration, and the percent distance they threshold is the same quantity the Disparity Index plots as an oscillator.
Modern envelope work varies the baseline more than the offset rule: kernel and penalized smoothers, as in Nadaraya-Watson or Whittaker envelopes, follow price more faithfully than a plain average, with bands offset by a fixed amount or a smoothed error term. Traders who want volatility-aware sizing calibrate the offset against ATR or realized volatility at review time, or track price's position between the bands in the spirit of %B. One thing the construction never does is signal compression: a fixed envelope cannot narrow, so squeeze reads belong to BandWidth and its relatives.
How to Identify an Envelope on a Chart
Envelopes look like any band overlay at first glance; the fixed width is the giveaway:
- 1Find the baseline: a moving average or smoother running through the middle of the two bands.
- 2Check symmetry: the upper and lower lines should sit at equal proportional distances from that baseline.
- 3Watch the width through a volatility shift: an envelope keeps its relative width through quiet and wild stretches, while adaptive bands visibly breathe.
- 4Inspect the settings: an envelope exposes a length plus an offset percent, not a standard-deviation or ATR multiplier.
- 5Judge calibration: if ordinary bars tag the bands constantly the offset is too tight; if price never gets close, it is too wide.
How it's calculated
A pair of bands offset a fixed percentage above and below a moving average of price.
An EMA basis is a common variant, and some platforms offer a fixed point offset (Upper_t = Basis_t + d) instead of a percent.
Platform defaults for k differ widely (for example 10 on TradingView, 2.5 on StockCharts, 0.1 on MetaTrader), so k is tuned per market and timeframe.
Band width is constant in percent terms; unlike Bollinger Bands or Keltner Channels it does not adapt to volatility.
How traders use it
- As an overextension gauge: price reaching or exceeding a band flags an unusually large displacement from the baseline, which range traders fade back toward the average, accepting that strong trends can hold price outside the band for extended stretches.
- As a whipsaw filter: requiring a close beyond the envelope, rather than a mere baseline cross, adds a dead zone around the average that suppresses many false moving-average crossover signals at the cost of later entries.
- As a trend channel: in steady trends the baseline plus one band can contain most of the swing, so pullbacks to the baseline or the near band become continuation entries while the far band frames profit-taking.
- As a scaling grid: mean-reversion traders add in steps as price pushes deeper beyond the band and exit toward the baseline, a ladder rather than a single trigger.
- As a recalibration routine: the offset is reset on a schedule so the bands contain a chosen share of recent closes, or re-anchored to a volatility percentile, keeping the fixed geometry honest as conditions drift.
Envelope vs related concepts
Bollinger Bands: Width is a multiple of the standard deviation of recent closes, so the bands expand and contract automatically with volatility; an envelope's width only changes when you change the setting.
Keltner Channels: Offset by a multiple of ATR rather than a fixed percent, so the channel adapts to average bar range and gaps; a percentage envelope treats a quiet week and a wild week identically.
Donchian Channels: Built from rolling highest highs and lowest lows rather than offsets around an average; the channel hugs recent extremes and serves breakout logic instead of overextension fades.
Concept family
Volatility
57 concepts mapped · 57 in the Library
Envelope FAQ
Turn Envelope into a trading strategy.
Take any implementation from this page into Quant, then build on it, backtest it on real data, and keep refining it in conversation.