Concept
Mass Index
Mass Index is a Volatility concept. The Library holds 1 implementation, a working definition you can pull into Quant.
reversal bulge
The standard Mass Index indicator
Mass Index exactly as classically defined: the faithful reference build of the original formula, free to run in Quant.
What is the Mass Index?
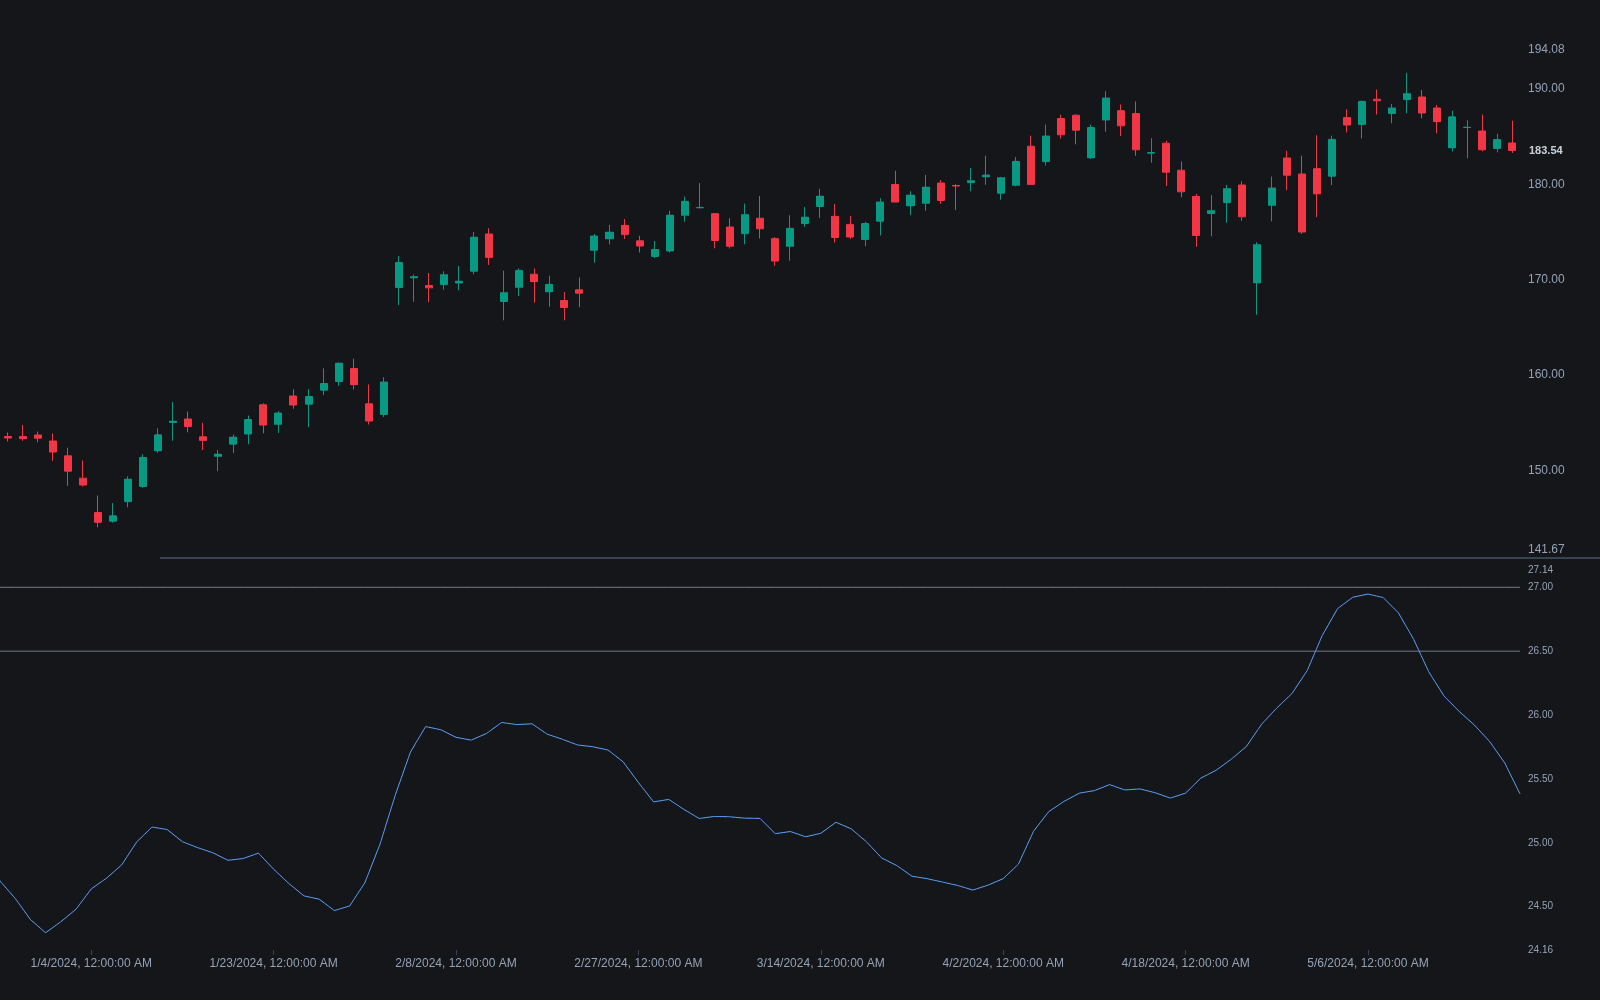
The Mass Index is Donald Dorsey's range-based reversal indicator, introduced in Technical Analysis of Stocks and Commodities in the early 1990s. It sums, over 25 bars, the ratio of a 9-period EMA of the high-low range to a double-smoothed EMA of the same range. When ranges widen relative to their own smoothed baseline, the ratio pushes above 1 and the sum inflates; when ranges settle, it deflates. The result oscillates in a band typically in the low-to-mid 20s.
Its signature signal is the reversal bulge: the index rises above 27 and then drops back below 26.5. Dorsey's argument was that a burst of range expansion followed by contraction often marks the exhaustion of the prevailing move, whatever its direction. The Mass Index deliberately carries no directional information, so the bulge says a reversal is more likely, not which way price will go.
Traders care about it as one of the few classic tools built specifically to time trend exhaustion from volatility structure rather than from price direction or momentum. Because it is direction-blind, it is almost always paired with a trend filter; Dorsey himself suggested reading the slope of a short EMA of price to decide which way to trade a bulge.
How to spot a reversal bulge
The bulge is a two-part event on the indicator pane, read against the prevailing price trend.
- 1Establish the prevailing trend on the price chart first; the bulge only means something as a potential ending to an existing move.
- 2Watch for the Mass Index to push up through 27, showing that bar ranges have expanded well beyond their smoothed baseline.
- 3Wait for the drop back below 26.5. The signal is the round trip, not the peak; an index that stays elevated is ongoing expansion, not a bulge.
- 4Take direction from a separate tool, such as the slope of a short EMA of price, since the bulge itself is direction-neutral.
- 5Treat near-misses honestly: many charts bulge to 26 and roll over, and some traders relax the thresholds, but the further you drift from 27/26.5 the less the historical convention applies.
How it's calculated
A 25-bar sum of the ratio between a single-smoothed and double-smoothed EMA of the bar range.
With the classic 9/9/25 settings a neutral market prints near 25, since each ratio hovers around 1.
The 27 and 26.5 thresholds were calibrated on daily bars; other timeframes and settings shift the operating band.
How traders use it
- As a reversal timer: the 27-then-26.5 bulge flags that a directional move has burned through a range-expansion episode, a common precondition for tops and bottoms, though many bulges resolve into consolidation rather than full reversal.
- Paired with a direction filter: since the index is direction-blind, traders combine the bulge with a short EMA slope, structure breaks, or divergence evidence to choose the trade's side.
- As a screen: scanning for markets whose Mass Index is approaching 27 builds a watchlist of trends that may be entering their exhaustion phase.
- Its limitations are real: signals are infrequent, thresholds are calibrated to daily charts, and because it ignores gaps (the range is high minus low), gap-driven instruments can exhaust without ever printing a bulge.
Mass Index vs other range-based tools
Chaikin Volatility: Both build on the high-low spread and ignore gaps, but Chaikin Volatility outputs a rate of change with no fixed thresholds, while the Mass Index compresses range behavior into a bounded sum with a named, specific signal.
ATR: ATR is a general-purpose volatility level in price units, gap-aware, with no built-in signal. The Mass Index is a special-purpose construction whose only job is detecting the expansion-contraction sequence of a reversal bulge.
Bollinger Squeeze: The squeeze looks for unusual contraction as the setup and expansion as the trigger. The Mass Index inverts the sequence: expansion first, then contraction as the signal that a move is ending.
Concept family
Volatility
57 concepts mapped · 57 in the Library
Mass Index FAQ
Turn Mass Index into a trading strategy.
Take the implementation from this page into Quant, then build on it, backtest it on real data, and keep refining it in conversation.