Concept
Bollinger Squeeze
Bollinger Squeeze is a Volatility concept. The Library holds 1 implementation, a working definition you can pull into Quant.
Top Bollinger Squeeze indicator
The top custom implementation, built on the original standard Bollinger Squeeze formula.
1 total
From studying Bollinger Squeeze to trading it: take the implementation below into Quant and backtest it instantly.
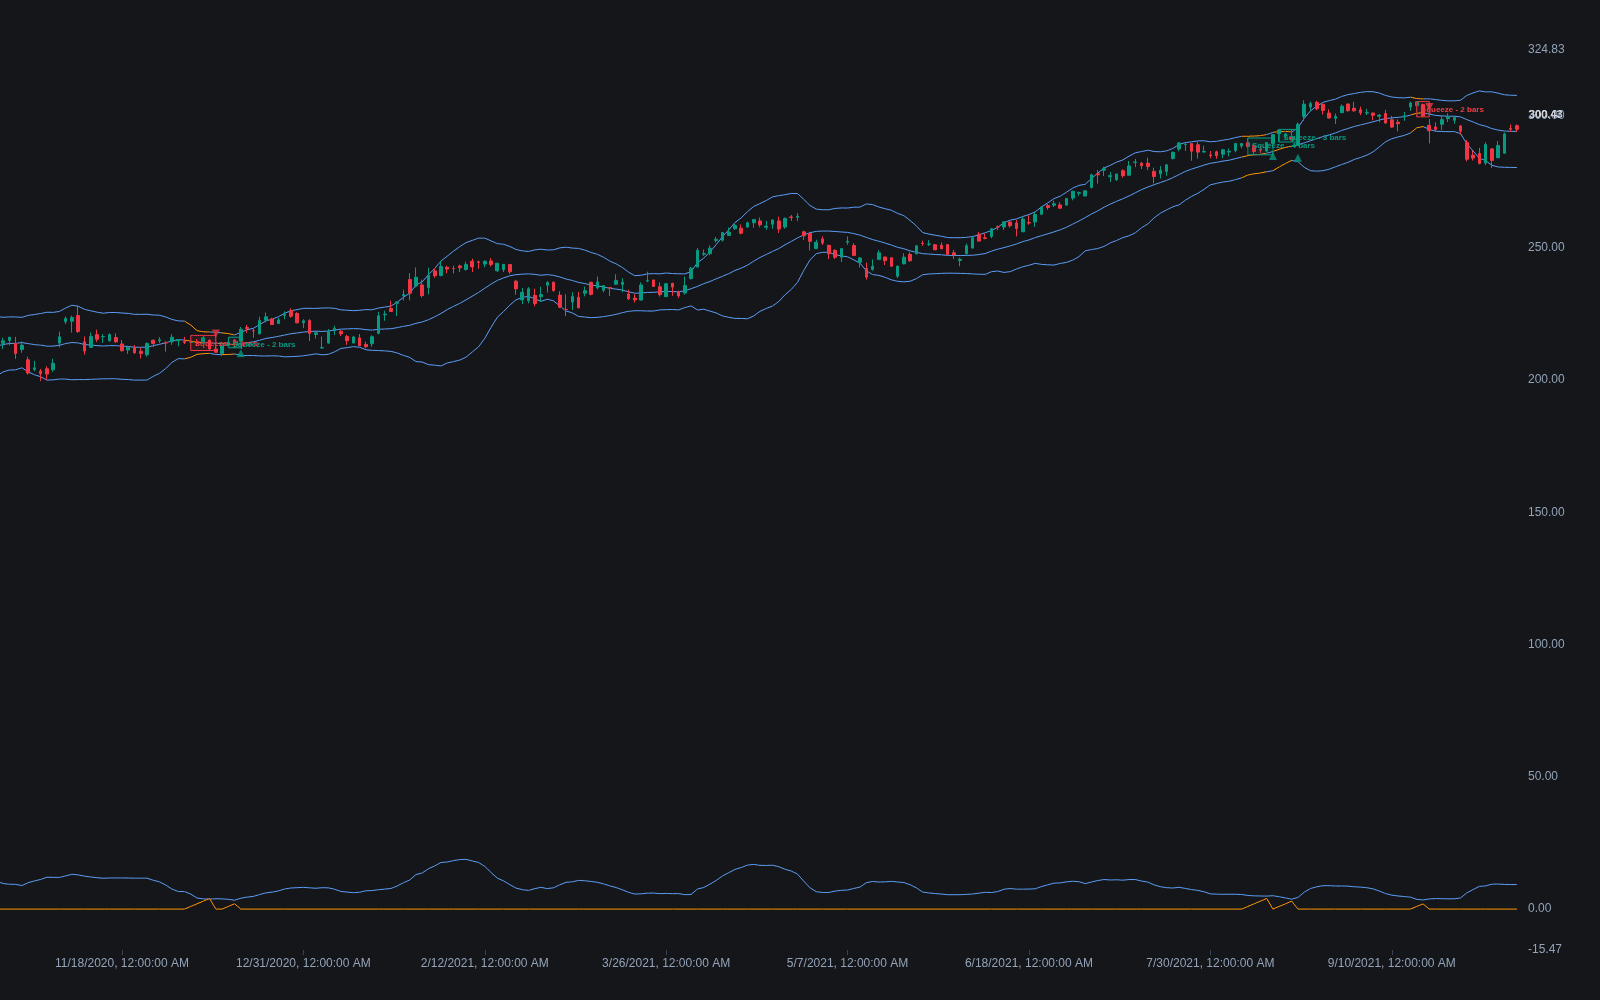
What is a Bollinger Squeeze?
A Bollinger Squeeze is a volatility contraction read directly off Bollinger Bands. Because the bands sit a set number of standard deviations around a moving average, they tighten mechanically when price movement narrows. John Bollinger measured the effect with BandWidth (upper band minus lower band, divided by the middle band) and defined a squeeze as BandWidth falling to its lowest level over a lookback window, six months in his original framing. Tight bands are therefore a measurement of quiet price action, not a subjective read of the chart.
The squeeze matters because volatility tends to run in cycles: unusually quiet stretches are often followed by expansions, so a squeeze flags conditions where a directional move may be building. It says nothing about direction on its own, and not every squeeze resolves into a trend. Traders therefore trade the release, the moment the bands turn outward and price leaves the compressed range, usually with confirmation, since Bollinger himself warned that the first break out of a squeeze can be a head fake. Definitions also vary by source: some platforms use the lowest-BandWidth test, while others declare a squeeze only when the bands trade inside Keltner Channels, the test popularized by the TTM Squeeze.
How to identify a Bollinger Squeeze
The squeeze is a measurable condition, so identifying one is a calculation plus a judgment about what counts as unusually tight.
- 1Plot Bollinger Bands with the standard construction: a 20-period simple moving average with bands two standard deviations above and below it.
- 2Add BandWidth, computed as the upper band minus the lower band, divided by the middle band. Normalizing by the middle band lets you compare tightness across time and across instruments.
- 3Flag a squeeze when BandWidth reaches its lowest level over your lookback window. Bollinger's guideline was the lowest reading in six months (roughly 125 daily bars); percentile variants flag readings near the bottom of their historical range, and an alternative test declares the squeeze on while both bands sit inside Keltner Channels.
- 4Mark the price range that formed during the squeeze and watch for the release: bands turning outward while price closes beyond that range. Treat volume and follow-through as confirmation, because the first break can reverse.
How it's calculated
Flags bars where Bollinger Band width contracts to the lowest level of a lookback, marking an unusually compressed volatility phase.
John Bollinger defines the Squeeze as BandWidth at its lowest level in about six months, roughly 125 daily bars.
The TTM Squeeze variant instead flags bars where both Bollinger Bands sit inside the Keltner Channels.
Some platforms plot BandWidth as a percentage by multiplying by 100.
How traders use it
- As the waiting condition for breakout setups: the squeeze says volatility is compressed, and the trade comes from the release, a close beyond the squeeze range as the bands widen. Direction is read from the breakout itself, never from the squeeze.
- With confirmation filters against head fakes: Bollinger warned that the first move out of a squeeze can be a false breakout that reverses through the opposite side, so many traders require a confirming close, a successful retest, or expanding volume before entering.
- As a scanning criterion: ranking BandWidth across a watchlist surfaces the quietest charts, concentrating attention where expansion potential is building rather than on moves already underway.
- As a volatility-regime marker: an active squeeze labels the market range-bound, which argues for smaller expectations and patience until expansion actually arrives, and warns that tactics tuned to quiet conditions may soon stop working.
Bollinger Squeeze vs related concepts
TTM Squeeze: The TTM version defines compression as Bollinger Bands trading entirely inside Keltner Channels and adds a momentum histogram to suggest release direction. The classic Bollinger Squeeze needs only BandWidth at a lookback low; the TTM test is a binary on/off condition, cleaner to code but dependent on two indicators' settings.
BandWidth: BandWidth is the raw measurement: band spread divided by the middle band. The squeeze is a condition read from that series, a relative low over some window. Every squeeze definition consumes BandWidth or an equivalent, but a BandWidth plot by itself makes no claim about what counts as unusually tight.
Volatility Contraction Pattern: VCP reads the same compression through price structure: successively shallower pullbacks tightening into a pivot while volume dries up. The squeeze reduces all of that to a single indicator condition, which makes it easier to scan for but blind to the structural detail a VCP analyst requires.
Concept family
Volatility
57 concepts mapped · 57 in the Library
Bollinger Squeeze FAQ
Turn Bollinger Squeeze into a trading strategy.
Take the implementation from this page into Quant, then build on it, backtest it on real data, and keep refining it in conversation.