Concept
STARC Bands
STARC Bands are Volatility concepts. The Library holds 1 implementation, a working definition you can pull into Quant.
Top STARC Bands indicator
The top custom implementation, built on the original standard STARC Bands formula.
1 total
Want to trade STARC Bands? The implementation below is one prompt away from a backtested strategy in Quant.
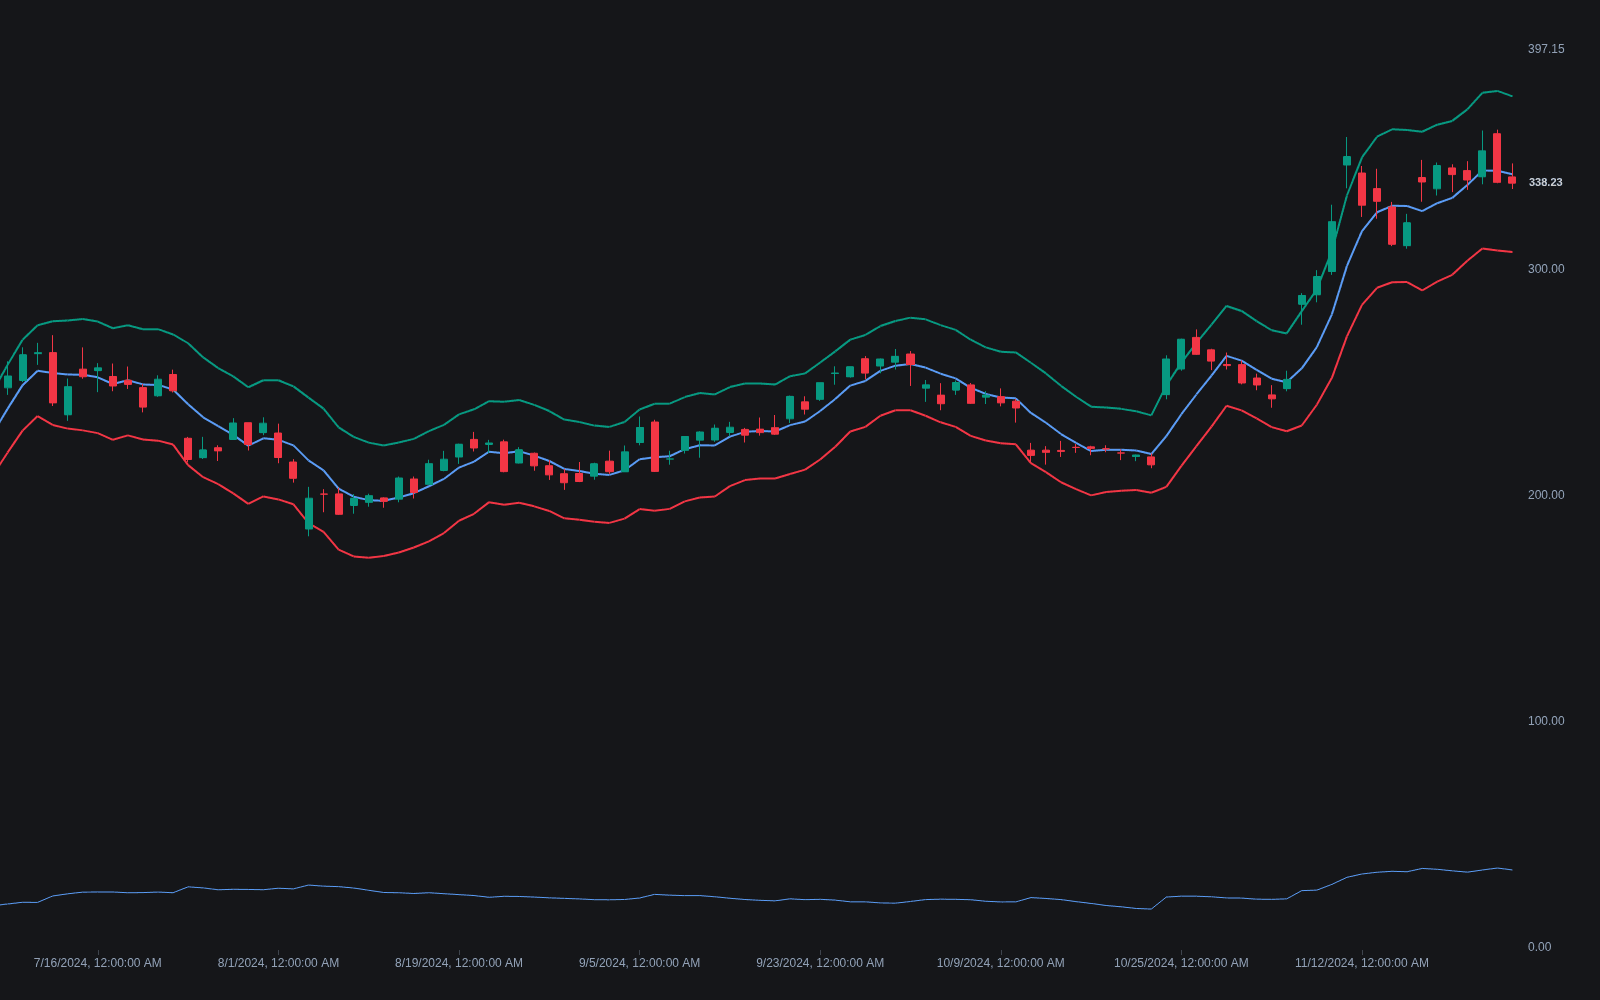
What are STARC Bands?
STARC bands (Stoller Average Range Channels, developed by Manning Stoller) are a volatility channel: a simple moving average with upper and lower bands offset by a multiple of the average true range. Published parameters vary by source; a short centerline of five or six bars with bands about two ATRs away is a common form. Because the offset comes from true range rather than the standard deviation behind Bollinger Bands, the channel tracks realized range directly, widening in fast markets and tightening in quiet ones.
Manning Stoller developed the channels in the 1980s, and they circulated through the futures and commodities community before appearing as a built-in study on charting platforms. Stoller's framing was about risk rather than signals: with price pressed against the upper band, a new long is entered at a level already stretched relative to recent average range, so the band argues for taking profits or hunting countertrend setups, with mirror-image logic at the lower band. In construction the bands sit closest to Keltner channels; the practical differences are the shorter centerline and the explicitly contrarian reading.
The input choice is worth noticing. True range includes gaps, so the bands respond to overnight jumps that close-to-close statistics understate, which mattered in the futures markets where the tool grew up. Width itself is information: expanding bands mark range expansion, contracting bands mark the quiet spells hunted by squeeze tools such as the TTM Squeeze, and comparing current width to its own history amounts to a volatility percentile read.
How to identify STARC bands on a chart
The channel is plotted directly; identification is mostly about reading position and width.
- 1Plot a short simple moving average (five or six bars in the classic form) with bands offset above and below by roughly two ATRs; many platforms ship this as a STARC or ATR-channel study.
- 2Locate price within the channel: near the centerline is neutral, pressed against a band is stretched relative to recent average range.
- 3Watch how touches resolve: single tags that reject back toward the centerline suggest rotation, while repeated closes hugging one band signal a trend strong enough to keep paying the stretch.
- 4Track width over time: widening bands confirm a volatility regime shift, narrowing bands warn that the next move may be a compression break rather than a rotation.
How it's calculated
Volatility bands that wrap a short simple moving average at offsets of a multiple of the Average True Range.
STARC stands for Stoller Average Range Channels, developed by Manning Stoller.
Defaults vary by platform: SMA lengths of 5 to 10, ATR lengths of 7 to 15, and multipliers near 2 are all common.
Band width is driven by ATR rather than standard deviation, which distinguishes STARC bands from Bollinger Bands.
How traders use it
- As entry-risk zones: near the upper band, fresh longs are stretched by construction, so trend traders wait for a rotation back toward the centerline instead of chasing.
- As mean-reversion fades in ranging conditions: a band touch paired with a reversal trigger, accepting that strong trends can ride a band for many bars.
- As volatility-aware exits: the centerline or opposite band as a trailing reference that adapts to current range instead of a fixed distance.
- As a sizing input: because band distance is denominated in ATR, the channel doubles as a position-sizing reference, with stops placed beyond the opposite band or at an ATR multiple so risk scales with conditions.
- As an oscillator overlay: the same construction applied to an indicator instead of price, as in the library's STARC-bands-on-RSI study, flagging oscillator readings stretched relative to their own recent range as a reversal warning.
STARC bands vs. other volatility channels
Keltner Channels: Structural siblings: both offset a moving average by an ATR multiple. Modern Keltner channels center on a longer EMA and are commonly read trend-following; STARC bands use a shorter SMA and were framed as zones that argue against entering at the band.
Bollinger Bands: Bollinger Bands offset by the standard deviation of closes, so gap-heavy movement can register differently; ATR-based STARC bands count the gaps. Bollinger extremes are also often read as breakout confirmation, the opposite of Stoller's contrarian framing.
ATR Bands: Generic ATR bands are the same recipe with free parameters, often centered on price or a longer average. STARC names Stoller's specific short-average variant and its risk-zone interpretation.
Donchian Channels: Donchian channels mark the window's highest high and lowest low, levels price actually set; STARC bands float around an average at an ATR offset and are routinely tagged and exceeded, which is exactly the stretch condition they exist to flag.
Concept family
Volatility
57 concepts mapped · 57 in the Library
STARC Bands FAQ
Turn STARC Bands into a trading strategy.
Take the implementation from this page into Quant, then build on it, backtest it on real data, and keep refining it in conversation.