Concept
Volatility Ratio
Volatility Ratio is a Volatility concept. The Library holds 1 implementation, a working definition you can pull into Quant.
Schwager
Top Volatility Ratio indicator
The top custom implementation, built on the original standard Volatility Ratio formula.
1 total
From studying Volatility Ratio to trading it: take the implementation below into Quant and backtest it instantly.
What is the Volatility Ratio?
The Volatility Ratio compares one volatility reading against a baseline to show, in a single number, whether conditions are unusually active. A widely cited version comes from Jack Schwager, who used the ratio of today's true range to the true range of the recent past to define wide-ranging days: bars that cover an outsized share of recent movement. Implementations vary in the denominator, some using the average true range of the window and others the window's full span, so the same label can sit on different formulas.
A second common construction divides short-lookback volatility by long-lookback volatility, using ATR or standard deviation on both sides. Readings above 1 mean the market is running hotter than its baseline (expansion) and readings below 1 mean it is cooling (contraction). Both versions share one idea: raw volatility only means something relative to that market's own norm.
The best-documented lineage runs through Schwager on Futures: Technical Analysis (1996), which treated wide-ranging days as candidates for meaningful turning points and screened for them with this ratio; with an average-true-range denominator, the commonly cited threshold is a reading near 2, a bar roughly double the recent average. True range is preferred over the plain high-low span so that opening gaps count toward a bar's size. The short-over-long variant generalizes the comparison from one bar to a window, smoothing the line and moving the natural threshold to 1.
The measure matters because volatility only reads correctly in context. A daily range that would be violent for a major currency pair is routine for a small-cap stock, so even a gauge such as realized volatility needs the instrument's own history before a reading counts as high or low; the ratio builds that comparison in. It also quantifies the expansion and contraction cycle that discretionary traders track visually with Bollinger Bands or Donchian Channels: a ratio pinned below 1 for weeks is the same compression that range expansion and contraction frameworks treat as fuel for the next directional move.
How to identify Volatility Ratio extremes on a chart
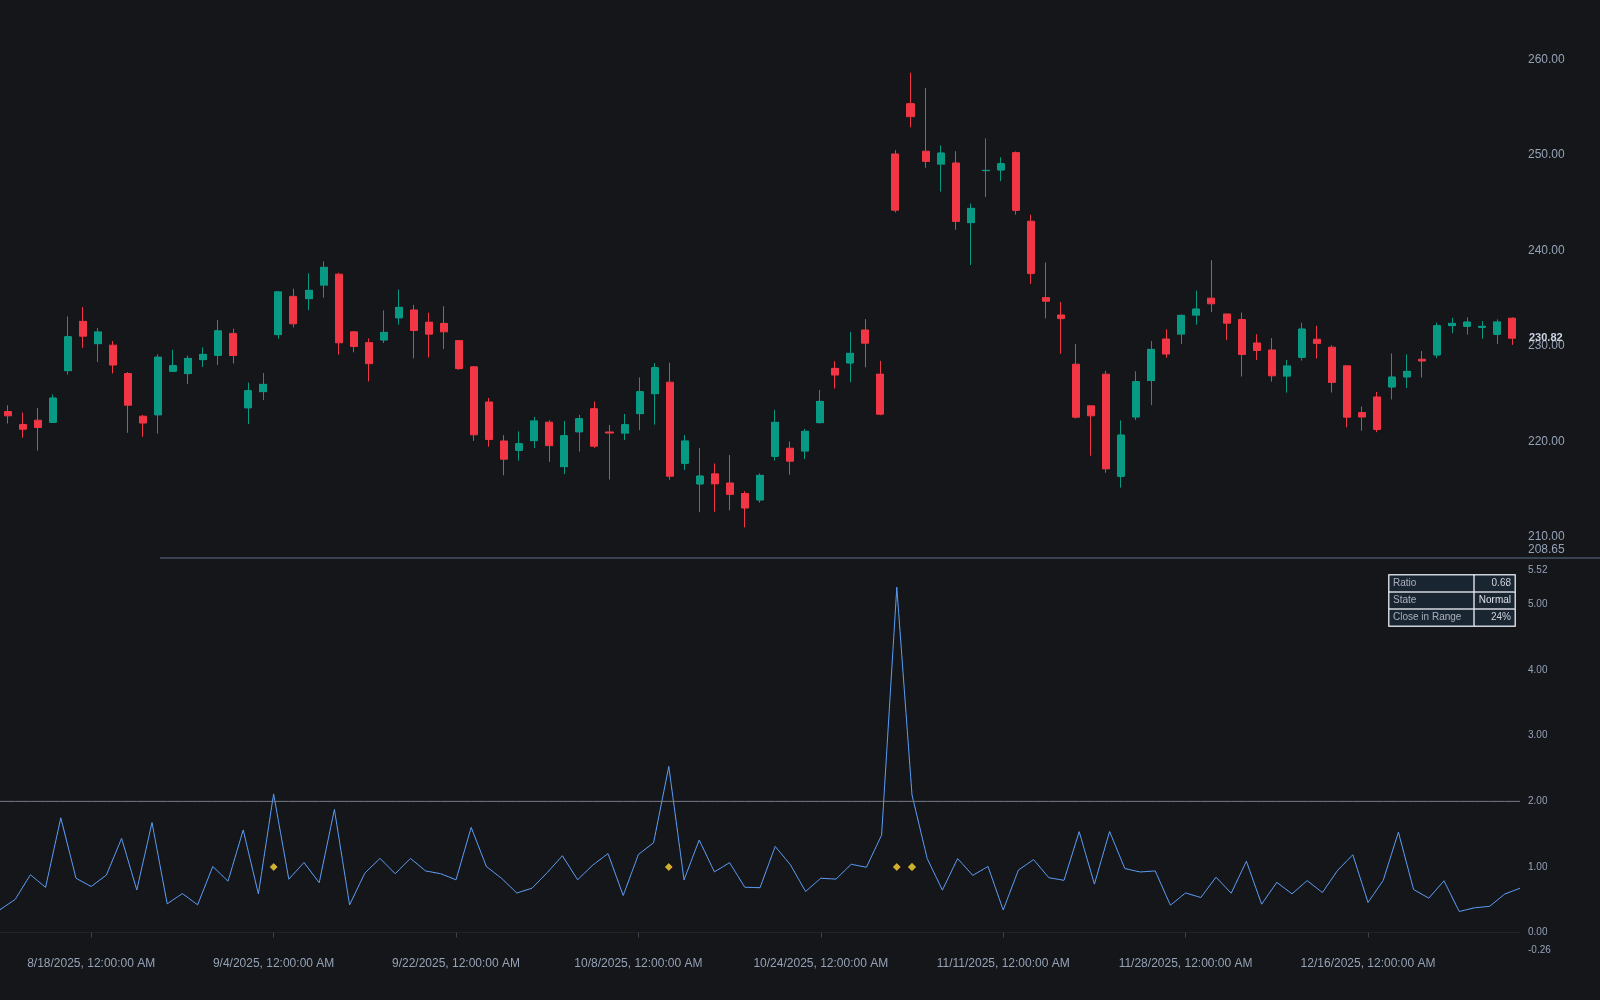
The ratio plots in its own pane, but each flagged reading corresponds to visible bars on price.
- 1Add a volatility ratio to the chart: either today's true range against a 10-15 bar baseline (the Schwager style) or a short ATR divided by a long ATR.
- 2Mark the spikes: with an average-true-range denominator, readings near 2 flag wide-range bars; on short-over-long versions, watch crossings of the 1 line.
- 3Relate each flagged bar to its context, since a wide bar breaking out of a base reads differently from one at the end of an extended trend.
- 4Note where the flagged bar closes within its range; the ratio measures size only, and the close supplies the directional hint.
- 5Scan the quiet stretches too: a ratio holding far below its norm marks compression, the state that tools like the TTM Squeeze formalize.
How it's calculated
The volatility ratio compares the current bar's true range with the true range of the whole recent window, so high readings flag wide-ranging bars.
Jack Schwager introduced it to flag wide-ranging days; readings of about 0.5 or more mark a bar whose range is a large share of the whole window's range.
Because the window includes the current bar, VR stays between 0 and 1; n = 14 is the common charting default.
Variants under the same name divide the bar's TR by an n-bar average true range instead (expansion above about 1.5 to 2), or divide short-window return stdev by long-window stdev.
How traders use it
- As an event-day flag: a high ratio marks wide-range bars that often coincide with news, breakouts, or capitulation, and such bars are commonly required as evidence that a move has real participation behind it.
- As a regime switch: the short-over-long version crossing above or below 1 is used to toggle between strategy modes, a simple cousin of fuller volatility regime classification.
- As a normalizer: because it is a ratio, the measure is comparable across symbols, which makes it useful in screens for markets leaving compression.
- As an exit adjuster: when the ratio runs hot, stops and targets planned against the quieter baseline are widened, often via ATR bands, so the position is managed against current conditions.
- As confirmation for compression setups: a ratio turning up from multi-week lows supports a resolving volatility contraction pattern, complementing width gauges such as BandWidth.
Volatility Ratio vs. related volatility measures
ATR: ATR averages true ranges into a price-denominated level: it says how large bars have been, in points. The volatility ratio divides current range by that kind of baseline, producing a dimensionless score of how unusual the present bar or window is.
BandWidth: BandWidth tracks the spread of Bollinger Bands relative to their midline, a normalized level of standard-deviation volatility. It flags compression and expansion well, but it is a single reading rather than an explicit comparison of one horizon against another.
Volatility Percentile/rank: The percentile rank locates current volatility within its own history on a bounded 0-100 scale, which standardizes thresholds across markets. The ratio is unbounded and reacts harder to single event bars; the rank is steadier and easier to compare.
Concept family
Volatility
57 concepts mapped · 57 in the Library
Volatility Ratio FAQ
Turn Volatility Ratio into a trading strategy.
Take the implementation from this page into Quant, then build on it, backtest it on real data, and keep refining it in conversation.