Concept
TTM Squeeze
TTM Squeeze, also known as BB-inside-KC + momentum, is a Volatility concept. The Library holds 1 implementation, a working definition you can pull into Quant.
Top TTM Squeeze indicator
The top custom implementation, built on the original standard TTM Squeeze formula.
1 total
Want to trade TTM Squeeze? The implementation below is one prompt away from a backtested strategy in Quant.
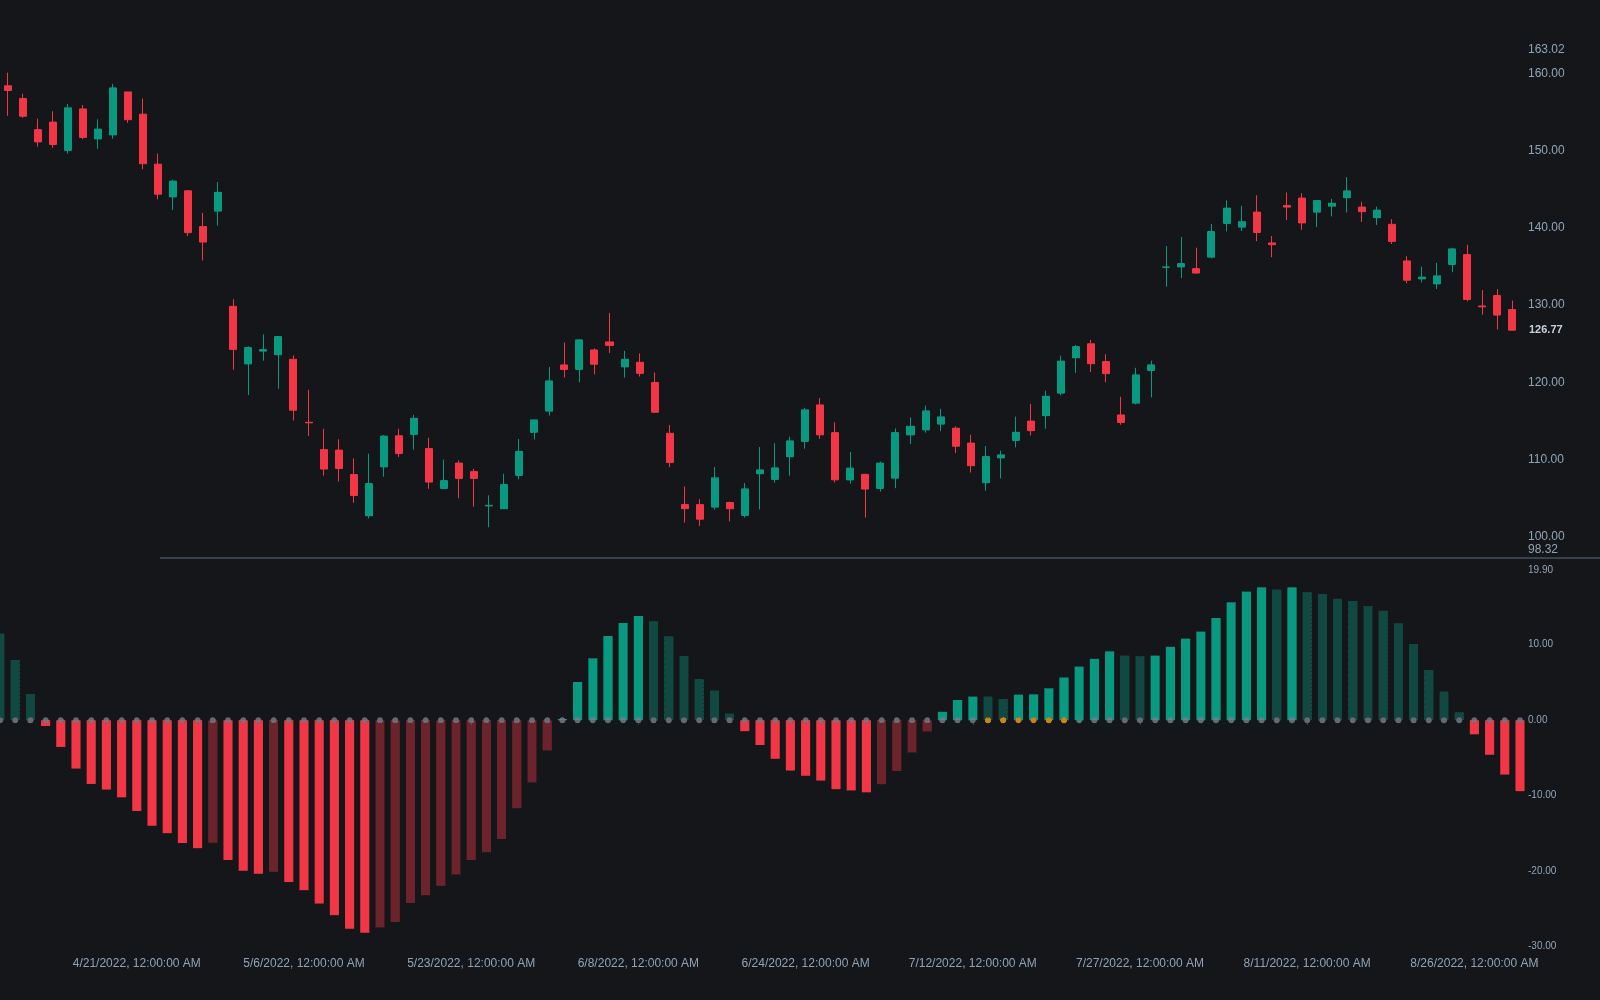
What is the TTM Squeeze?
The TTM Squeeze is a volatility-compression setup popularized by John Carter that combines two band systems into one condition: when Bollinger Bands contract until they trade entirely inside Keltner Channels, the market is "in a squeeze." Because Bollinger width is driven by standard deviation while Keltner width is driven by ATR, the bands only fit inside the channels when recent movement is unusually quiet relative to its own average range. The state is marked with dots on a zero line: squeeze on while the bands are inside, squeeze off (the "fire") when they expand back out.
Compression alone says nothing about direction, so the setup pairs the squeeze dots with a momentum histogram, commonly built by fitting a linear regression to price's displacement from an anchor midway between the recent range midpoint and a simple moving average. The working logic is a volatility cycle: contraction tends to precede expansion, so the squeeze identifies the coil, and the histogram's side and slope at the fire suggest which way the release is leaning. None of it is guaranteed; squeezes can fire into failed moves or cycle on and off through chop, which is why most treatments require the release itself, not the compression, to trigger anything.
How to read the TTM Squeeze
The read has two parts: a binary state (in a squeeze or not) and a directional lean taken from the momentum histogram.
- 1Check the squeeze state: the dots show "on" when the Bollinger Bands (commonly 20-period, 2 standard deviations) sit fully inside the Keltner Channels (commonly 20-period, 1.5 × ATR), and "off" otherwise.
- 2Count the compression: several consecutive squeeze-on bars mean volatility has stayed contracted; longer squeezes are watched for larger releases, though duration promises nothing about the size of the move.
- 3Wait for the fire: the first bar where the Bollinger Bands re-emerge outside the Keltner Channels ends the squeeze and is the traditional trigger bar.
- 4Take direction from the histogram: positive and rising favors the upside case, negative and falling the downside; a histogram fading back toward zero after the fire is the common exit or stand-aside cue.
How it's calculated
Flags volatility compression by testing whether Bollinger Bands sit inside Keltner Channels, with a regression-based momentum histogram for direction.
John Carter's original settings are n = 20, m_bb = 2, m_kc = 1.5.
The Squeeze Pro variant grades compression with three Keltner multipliers (2.0 low, 1.5 mid, 1.0 high).
Some platforms build the Keltner Channel from an EMA basis or SMA-smoothed true range, or use an EMA of close in the momentum midline, which shifts timing slightly.
How traders use it
- As breakout preparation: a squeeze flags compression before a possible range expansion, so traders build watchlists from symbols in multi-bar squeezes instead of chasing moves already underway.
- As a trigger: the classic entry acts on the first squeeze-off bar in the direction of the momentum histogram, then uses the histogram's fade toward zero to scale out or exit.
- Stacked across timeframes: squeezes forming simultaneously on, say, the hourly and daily charts are read as deeper compression, on the logic that nested coils release harder; that is a working assumption, not a guarantee.
- As a regime filter for other systems: squeeze-on periods mark quiet conditions where trend signals tend to whipsaw, so some strategies simply stand down until the squeeze releases.
TTM Squeeze vs related concepts
Bollinger Squeeze: Also a compression signal, but defined from Bollinger Bands alone (band width reaching multi-bar lows) rather than from the bands fitting inside Keltner Channels; the TTM version also adds a momentum histogram as its directional component.
BandWidth: A continuous measure of how wide the Bollinger Bands are. The TTM Squeeze turns a related idea into a binary state by benchmarking band width against an ATR-based channel instead of against BandWidth's own history.
Squeeze Release Direction: The general problem of judging which way any compression resolves. The TTM Squeeze answers it with its momentum histogram; other approaches lean on structure, volume, or higher-timeframe bias instead.
Concept family
Volatility
57 concepts mapped · 57 in the Library
TTM Squeeze FAQ
Turn TTM Squeeze into a trading strategy.
Take the implementation from this page into Quant, then build on it, backtest it on real data, and keep refining it in conversation.