Concept
Fibonacci Bollinger Bands
Fibonacci Bollinger Bands are Volatility concepts. The Library holds 1 implementation, a working definition you can pull into Quant.
Top Fibonacci Bollinger Bands indicator
The top custom implementation, built on the original standard Fibonacci Bollinger Bands formula.
1 total
The Fibonacci Bollinger Bands implementation below can become a backtested trading strategy — describe your rules and Quant writes the code.
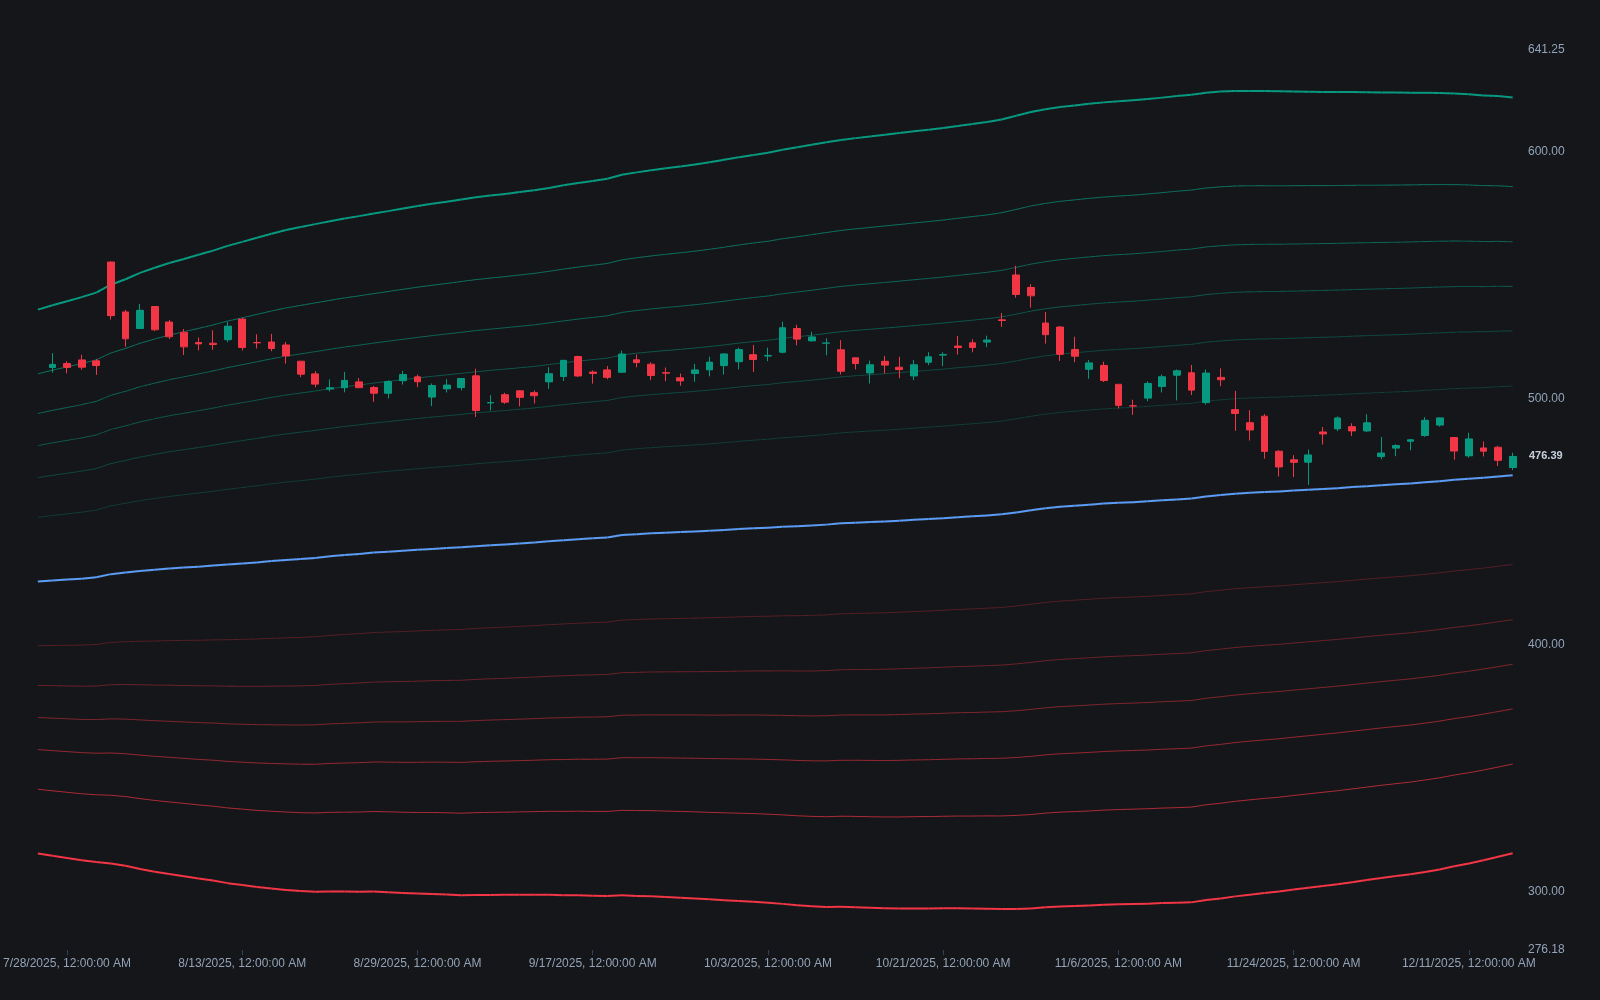
What are Fibonacci Bollinger Bands?
Fibonacci Bollinger Bands graft the Fibonacci ratio ladder onto a volatility envelope. The construction starts like standard Bollinger Bands: a moving-average basis (implementations vary; a longer VWMA is common) with an outer band a fixed number of standard deviations away, often three. Interior bands are then drawn at Fibonacci ratios of that outer distance, typically 0.236, 0.382, 0.5, 0.618, and 0.764 above and below the basis, producing a symmetric ladder of levels that widens and narrows with volatility.
The tool is community-bred rather than canonical: it spread through shared scripts on retail charting platforms (crypto charts especially), with the popular versions converging on the long volume-weighted basis and three-deviation outer rail. No published methodology stands behind the specific ratio choices; the design simply marries two familiar vocabularies and lets the market vote with usage.
The result is a graded map rather than a binary envelope. Standard bands only say whether price is inside or outside; the fib ladder marks intermediate rungs where pullbacks and rallies can stall, in the same spirit as a static fib retracement but anchored to a moving basis and scaled by current volatility. The usual cautions apply twice over: neither volatility bands nor Fibonacci ratios obligate price to react, so the rungs are candidate levels to plan around, not promises.
Reading the ladder is regime work first. With a long basis, the half of the ladder price occupies serves as the trend read, rung holds and losses grade pullbacks within it, and the outermost rail keeps the classic stretched-tag meaning. The whole geometry breathes with volatility, so rung touches during a squeeze mean little (every rung is close), while the same touches after expansion carry the full read; a BandWidth-style width check alongside keeps that distinction explicit.
How to read Fibonacci Bollinger Bands
The ladder is read from the basis outward, with the volatility cycle deciding how much any rung means.
- 1Confirm the construction: the basis type and length (a 200-period VWMA in the most-shared version) and the outer deviation multiple the ratios subdivide.
- 2Read the regime from the basis: price living above a rising basis keeps the bullish half of the ladder in play, and the mirror below.
- 3Grade pullbacks rung by rung: holds at 0.382 or 0.5 of the span read as ordinary trend corrections, while losses of successive rungs walk the read toward the basis.
- 4Keep the outer rail's classic meaning: tags of the outermost band mark stretch, faded in balance and respected as strength in trends.
- 5Check the width before trusting rungs: in compressed conditions every rung is nearby and touches are noise; after expansion the ladder's spacing means something.
- 6Prefer rungs with company: a ladder level overlapping a swing-anchored retracement or prior structure outranks the ratio alone.
How it's calculated
A volatility envelope that places band pairs at Fibonacci fractions of a full standard deviation width around a volume weighted basis.
The widely used community version defaults to a VWMA of typical price over 200 bars with m = 3.
Variants use an SMA basis, m = 2, or 0.786 in place of 0.764.
At f = 1.0 the outer pair is a plain standard deviation band with multiplier m, so the construction differs from classic Bollinger Bands only in the VWMA basis and the longer default length.
How traders use it
- As dynamic support and resistance: in a trend, traders watch pullbacks into the interior rungs for stall-and-continue behavior, treating a hold above a rung as evidence the trend is healthy.
- As a stretch gauge: a push into the outermost band flags an extended move the same way a standard band tag does, a fade candidate in ranging tape and a strength signal in trending tape.
- As a regime read: price holding the upper half of the ladder keeps a bullish bias, the lower half a bearish one, and oscillation around the basis marks balance.
- As a confluence ingredient: rungs that line up with swing-anchored retracements, prior highs and lows, or round numbers carry more weight in confluence scoring than either level type alone.
- As scan and alert structure: rung crossings and outer-rail tags translate directly into alert conditions, giving systematic users a volatility-scaled level set that recomputes itself instead of needing hand-drawn maintenance.
Fibonacci Bollinger Bands vs. other envelopes
Bollinger Bands: The parent tool plots one envelope at a fixed deviation multiple and is read inside-or-outside. Fibonacci Bollinger Bands subdivide the same span into a ratio ladder, trading that binary read for graded intermediate levels.
Keltner Channels: Keltner Channels scale their envelope by ATR around an EMA, producing a smoother band that responds to true range rather than close-to-close dispersion. The Fibonacci variant stays standard-deviation based and adds interior ratio lines.
Envelope: A plain envelope offsets the basis by a fixed percentage, so its width never adapts to conditions. Both Bollinger variants breathe with volatility; the Fibonacci version simply marks graduated rungs along the way.
Concept family
Volatility
57 concepts mapped · 57 in the Library
Fibonacci Bollinger Bands FAQ
Turn Fibonacci Bollinger Bands into a trading strategy.
Take the implementation from this page into Quant, then build on it, backtest it on real data, and keep refining it in conversation.