Concept
Waddah Attar Explosion
Waddah Attar Explosion is a Volatility concept. The Library holds 1 implementation, a working definition you can pull into Quant.
Top Waddah Attar Explosion indicator
The top custom implementation, built on the original standard Waddah Attar Explosion formula.
1 total
Want to trade Waddah Attar Explosion? The implementation below is one prompt away from a backtested strategy in Quant.
What is the Waddah Attar Explosion?
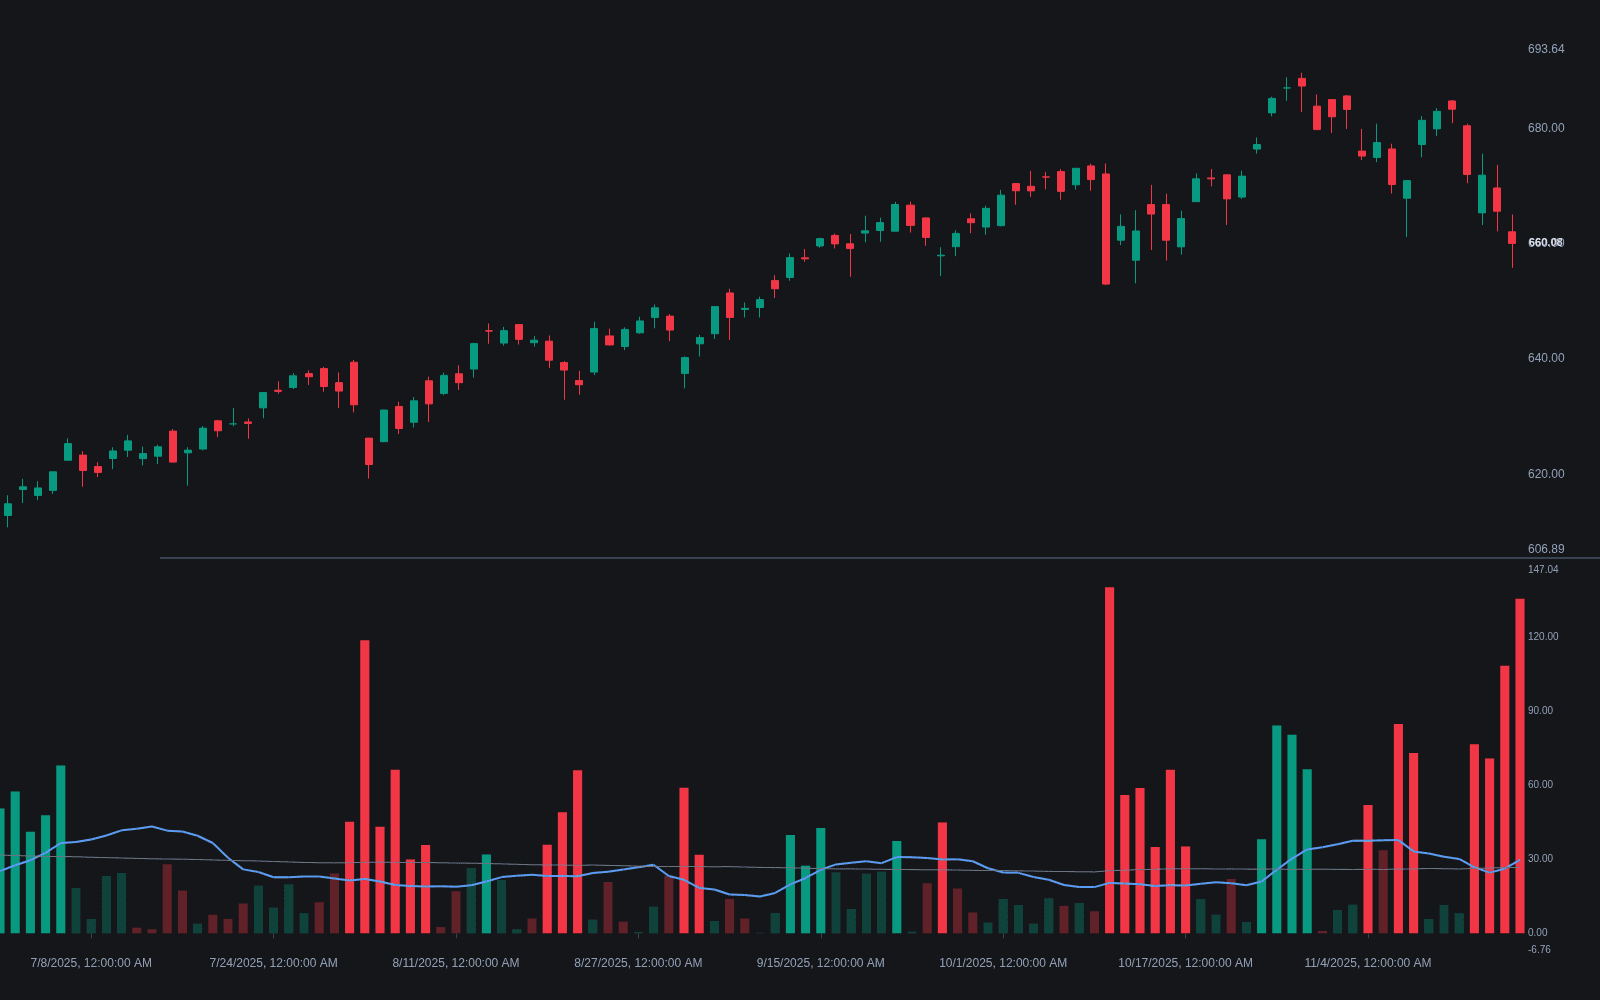
The Waddah Attar Explosion is a momentum-versus-volatility gate that emerged from the forex trading community, named after its creator, Waddah Attar. It plots a 'trend power' histogram, the bar-to-bar change in a MACD line scaled by a sensitivity multiplier (150 is a common default), against an 'explosion line' equal to the width between the upper and lower Bollinger Bands. Green histogram bars mark upward pressure, red bars downward. Most versions add a dead zone, a minimum threshold (fixed in some builds, ATR-derived in others) beneath which readings are treated as noise.
The logic: a move worth trading should show momentum expanding faster than the recent volatility envelope. A histogram bar rising above the explosion line (and clearing the dead zone) says directional energy exceeds ambient churn; a histogram below the line says conditions are compressed or trendless. It is a go/no-go filter with a directional color, not an entry, stop, or target system.
The tool spread from the MetaTrader ecosystem into every charting platform through independent ports, and the ports genuinely differ: shayankm's V2 and traderharikrishna's Bollinger-MACD V3 on TradingView make different choices about the dead zone, and loxx's variety-MA build lets the underlying averages be swapped entirely. The moving parts are few, one momentum engine, one volatility envelope, one noise floor, but each port tunes them differently, so two charts labeled WAE can disagree on the same bar. Anyone backtesting or comparing signals needs to verify which formula their version actually runs.
Its character follows from the construction. The histogram is a first difference of a smoothed line, so it is jumpy by nature and reacts hard to single large bars, which is why the dead zone exists at all; the BandWidth-style explosion line rises after volatility has already expanded, so the gate opens a little late by design. The multiplier is cosmetic scaling, not information. None of this breaks the tool, but it explains the failure modes: news spikes that flash momentum for a bar or two, and slow grinding trends whose momentum never clears an envelope inflated by an earlier shock.
How to identify Waddah Attar Explosion signals on charts
The indicator plots a colored histogram, the explosion line, and usually a dead-zone line in a subpanel. The tradeable state is a specific stacking of the three.
- 1Verify the version first: check which MACD lengths, band settings, multiplier, and dead-zone rule your port uses, since builds differ enough to change signals on the same chart.
- 2Look for the go state: a histogram bar that stands above both the explosion line and the dead zone, with color giving the direction of the pressure.
- 3Treat everything below the dead zone as no-trade noise, whatever the color; small histogram flickers there are the churn the threshold exists to hide.
- 4Watch the transition, not just the level: a histogram erupting through a flat or falling explosion line marks the release from compression, the same turn squeeze tools like the TTM Squeeze are built to catch.
- 5Read exhaustion from the stack collapsing: the histogram dropping back below the explosion line while the envelope keeps widening says the move's energy is fading relative to its own volatility.
How traders use it
- As an entry gate for trend systems: breakout or pullback signals are taken only while the histogram exceeds both the explosion line and the dead zone, and skipped when momentum cannot clear the envelope.
- As a direction filter: green bars permit longs and red bars permit shorts, with histogram height read as the force behind the move rather than as a price objective.
- As a compression-release timer: a histogram erupting through a flat explosion line marks the turn from contraction to expansion, pairing naturally with squeeze-style setups.
- As the release leg of a squeeze stack: Bollinger squeeze or TTM-style compression flags the coiled state, and the WAE go condition supplies the direction and the permission when the coil lets go.
- As a stand-down and exit aid: when the histogram falls back under the explosion line or the dead zone mid-trade, momentum no longer exceeds ambient churn, an honest cue to tighten stops or stop adding rather than a reversal signal.
Waddah Attar Explosion vs other volatility gates
TTM Squeeze: The squeeze flags a state: bands inside channels, compression building. WAE gates each bar: is momentum bigger than the envelope right now. The squeeze is earlier and directionless until release; WAE is directional but only speaks once the move is already pushing.
BandWidth: BandWidth is the raw width of the Bollinger envelope, a pure volatility series with no direction. WAE uses that same width as a hurdle and asks whether directional momentum clears it, adding a sign and a threshold to what BandWidth only measures.
Range Expansion/contraction: The expansion/contraction cycle is the market behavior itself, however measured. WAE is one specific meter for the expansion side, tuned to fire when momentum outruns the recent envelope; it says nothing during contraction except stay out.
Concept family
Volatility
57 concepts mapped · 57 in the Library
Waddah Attar Explosion FAQ
Turn Waddah Attar Explosion into a trading strategy.
Take the implementation from this page into Quant, then build on it, backtest it on real data, and keep refining it in conversation.