Liquidity Sweep
Liquidity Sweep, also known as grab, purge, stop hunt, stop run, is a Smart Money Concepts / ICT concept. The Library holds 28 implementations, each one a working definition you can pull into Quant.
Top Liquidity Sweep indicators
The top custom implementations, built on the original standard Liquidity Sweep formula.
Every Liquidity Sweep implementation here is strategy-ready: open one in Quant, set your rules, and it backtests automatically.
What is a Liquidity Sweep?
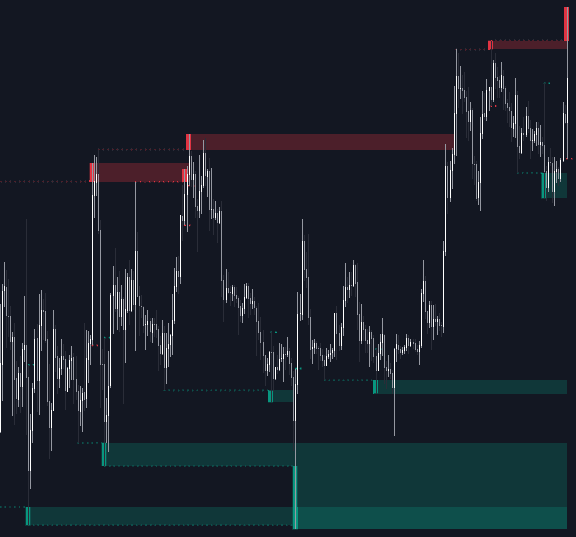
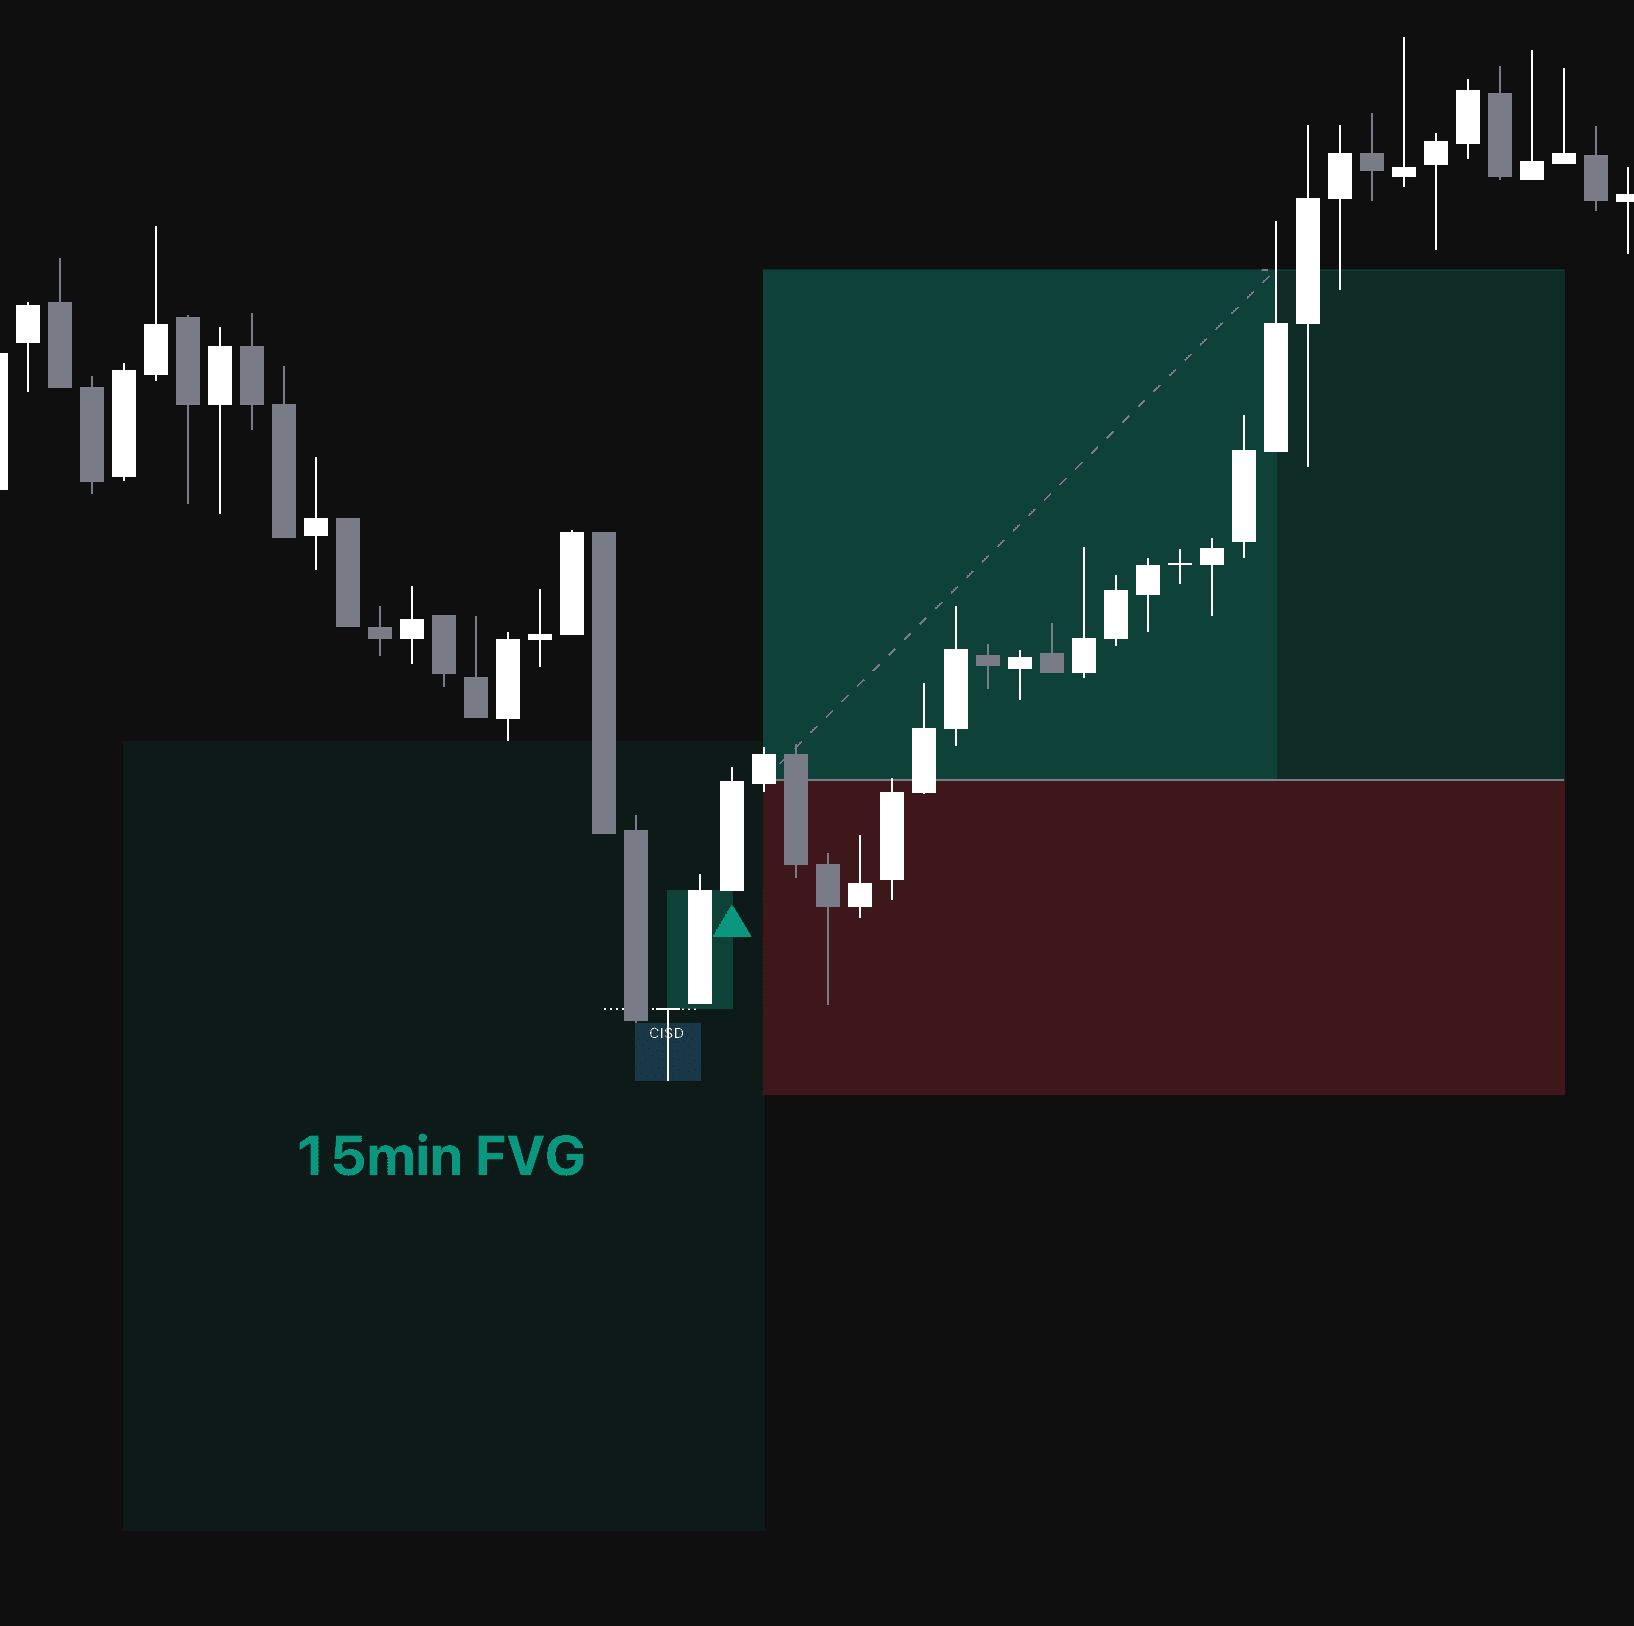
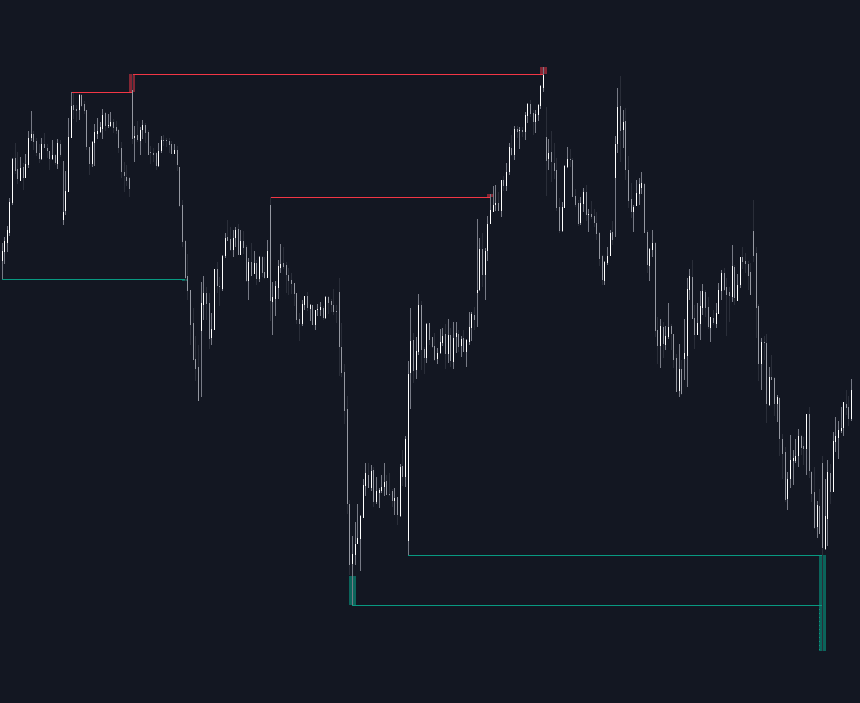
A liquidity sweep is a run through a level where resting orders cluster: the stop-losses and breakout entries sitting just beyond an obvious high or low. When price trades through the level, fills those orders, and then fails to hold beyond it, Smart Money Concepts / ICT traders say the level was swept: the move is read as a collection of buy-side liquidity or sell-side liquidity rather than the start of a trend.
The classic anatomy is a wick through a prior swing high or low (or through equal highs or lows, the most visible liquidity pools), followed by a close back inside the old range. The vocabulary varies more than the event: grab, purge, raid, stop run, and stop hunt all describe the same footprint. Definitions are contested at the edges. Some traders require the close back inside on the sweeping candle itself, while others accept any tag-and-reject that resolves within a few bars.
The concept matters because it inverts the breakout playbook. Where classical technical analysis reads a push through resistance as strength, the sweep reading asks whether the push was accepted or rejected, and treats a swift rejection as evidence the other side has taken control. Many SMC reversal models begin with a sweep of a significant level, and the presence or absence of follow-through after the break is the tell traders use to judge which side is trapped.
How to identify a liquidity sweep
A sweep is defined by what happens after the level breaks, so identification is a two-part check: the run, then the failure.
- 1Mark where liquidity rests: prior swing highs and lows, equal highs/lows, and session or prior-day extremes. These are the levels stop orders accumulate behind.
- 2Watch for price to trade through one of those levels, often quickly, and often on a wick rather than a sustained advance.
- 3Require the failure: price closes back inside the prior range instead of holding beyond the level. A close that holds beyond it, with continuation, is a breakout, not a sweep.
- 4Look for confirmation on the reversal side (displacement away from the swept level or a change of character on a lower timeframe) before treating the sweep as tradable evidence.
How traders use it
- As reversal context: many SMC reversal models begin with a sweep of a meaningful pool followed by a structure shift, with entries taken on the retrace into a fair value gap or order block left behind by the reversal leg.
- As a breakout filter: before chasing a break of a watched level, waiting for a close beyond it (or a retest that holds) screens out many sweeps. The trade-off is real: the filter costs entry price on genuine breakouts in exchange for skipping the traps.
- For stop placement: the reversal thesis is invalidated if price trades back through the swept extreme, so stops go beyond the sweep's wick, where the exit line is unambiguous, rather than inside the range where ordinary rotation reaches.
- As a session-timing anchor: sweeps of session liquidity (the Asian range, London or New York session highs and lows) are the opening move of several time-based models, which look for the sweep in one window and the true move in the next.
Liquidity sweep vs similar concepts
Swing Failure Pattern: An SFP is the same event codified as a candle pattern: wick beyond a prior swing, close back inside. "Liquidity sweep" names the mechanism (stops were collected), while "SFP" names the printed evidence. Most SFPs qualify as sweeps, but sweep is the broader term: it doesn't require the failure to complete within one or two candles.
False Breakout: The classical-TA name for the same disappointment. "False breakout" describes the outcome (the break didn't hold), while "sweep" asserts a reading of intent: the level was the target of the move, not an obstacle in its way. Same chart event, different explanatory frame.
Inducement: Inducement is the bait (a minor, engineered-looking pocket of liquidity left inside a price leg), while the sweep is the act of running a pool. In common usage, inducement is what gets swept before price reaches the level the trader actually cares about.
Break of Structure: Opposite conclusions from the same level. A break of structure is acceptance: price closes through a swing and follows through, confirming the trend. A sweep is rejection: price trades through and fails. Until the close and the follow-through print, the two are indistinguishable, which is why sweep traders wait.
More Liquidity Sweep implementations
- Session Sweeps
- Sweeps & IFVGs
- ICT Concepts
- HTF Sweep Signals
- Sweep Volume Index
- Swing Breakout Sequence
- Price Action Concepts
- LuxAlgo - Screener (PAC)
- POC Sweep Reclaim
- 3-Step Institutional Trap
- CRT Sweep & Setup Highlighter
- Rubber Band Liquidity Signals
- Session Sweep & iFVG RR
- MSS Sweep Fib Retrace
- Swing Failure Pattern (SFP)
- Market Structure with Inducements & Sweeps
- Pure Price Action ICT Tools
Concept family
Smart Money Concepts / ICT
54 concepts mapped · 54 in the Library
Liquidity Sweep FAQ
Turn Liquidity Sweep into a trading strategy.
Take any implementation from this page into Quant, then build on it, backtest it on real data, and keep refining it in conversation.