Williams VIX Fix
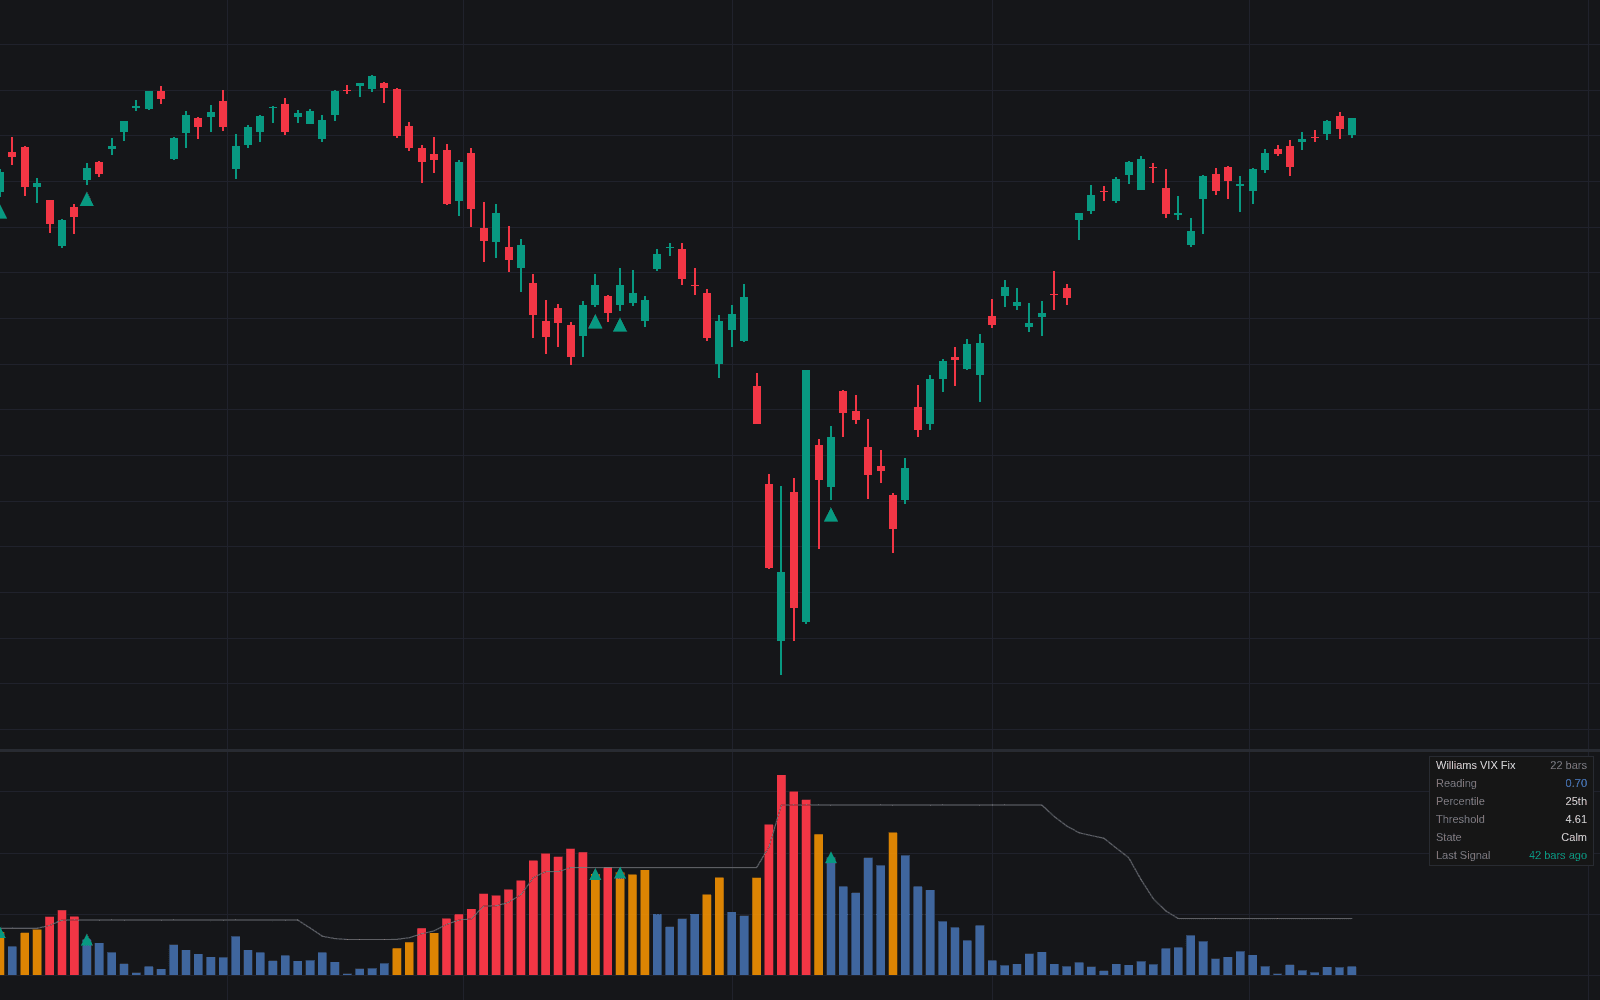
Williams VIX Fix, also known as VIX Fix, WVF, synthetic VIX, is a Volatility concept. The Library holds 1 implementation, a working definition you can pull into Quant.
Top Williams VIX Fix indicator
The top custom implementation, built on the original standard Williams VIX Fix formula.
1 total
The Williams VIX Fix implementation below can become a backtested trading strategy — describe your rules and Quant writes the code.
What is the Williams VIX Fix?
The Williams VIX Fix is Larry Williams' synthetic volatility index built from price alone: the drop from the highest close of the last 22 bars to the current bar's low, as a percentage of that highest close. Williams introduced it in The VIX Fix, an article in the December 2007 issue of Active Trader magazine, to reproduce the behavior of the VIX on markets that have no options-based fear gauge of their own.
The construction targets what makes the VIX useful. The VIX jumps when stocks fall hard and fast, because demand for protection peaks at exactly those moments; the VIX Fix jumps when the current low sits far below the recent closing peak, the same condition read from the chart. Williams presented it as tracking the VIX's spikes closely on the S&P 500, and since it needs only highs, lows and closes it runs on any market. It is a short-memory drawdown gauge, not a statistical volatility estimate: upside movement never raises it.
Most of its current reach comes from ChrisMoody's CM_Williams_Vix_Fix, a widely used open-source TradingView script that plots the reading as a histogram and highlights bars above either an upper Bollinger Band of the series or 85 percent of its highest value over the last 50 bars. Those two thresholds turned a raw line into a spike detector, and most later versions keep them. Community variants also invert the formula, measuring the current high against the lowest close, to flag euphoric tops, a use outside Williams' original.
What a spike means is the contested part. Extreme readings mark capitulation-style selling, and in equity indices such panics have often clustered near swing lows, but a high reading describes how far price has fallen; it does not forecast a turn. In a sustained decline the VIX Fix can spike repeatedly on the way down, so traders treat a spike as a possible start of a bottoming process, confirmed when the reading rolls over and price stops making new lows.
How it's calculated
The percentage drop from the recent closing high to the current low, plus the two spike thresholds from the widely used chart version.
Lines 1 and 2 are Williams' formula; lines 3 to 5 are the thresholds popularized by the CM_Williams_Vix_Fix script, not part of the original article.
The reading cannot fall below 0, since the highest close is never below the current low; it rises only on downside travel.
Inverse variants for tops replace the highest close with the lowest close of the window and the current low with the current high.
How traders use it
- As a capitulation flag: histogram bars breaking above the upper band or the range-high threshold mark panic selling, the moments when mean-reversion traders and long-term buyers start watching for a low.
- As a VIX substitute: on single stocks, commodities, currencies and crypto that lack a published volatility index, the VIX Fix supplies the same spike-at-lows read from the chart itself.
- With confirmation: a common trigger waits for the first bar back below the thresholds while price holds above the spike low, often alongside oversold momentum or a selling climax on volume as independent evidence.
- As a regime read: a reading that stays elevated for weeks marks a drawdown regime in which fading every spike is dangerous; ranking it with a volatility percentile puts today's spike in the market's own history.
Williams VIX Fix vs related measures
VIX: The VIX is computed by Cboe from S&P 500 option prices and prices the next 30 days' expected volatility. The VIX Fix is a backward-looking drawdown percentage from price alone. It imitates the VIX's spikes, not its level: a VIX of 30 and a VIX Fix of 30 mean unrelated things.
Realized Volatility: Realized volatility measures the dispersion of returns in both directions. The VIX Fix measures only how far the low sits below the recent closing high, so a smooth rally reads near zero and a steady decline reads high even when daily returns are calm.
Williams %R: Larry Williams' earlier oscillator locates the close within the lookback's high-low range and is read against overbought and oversold bands. The VIX Fix shares the stochastic-style geometry but anchors to the highest close and the current low, and it is read for spikes.
Concept family
Volatility
61 concepts mapped · 61 in the Library
Williams VIX Fix FAQ
Turn Williams VIX Fix into a trading strategy.
Take the implementation from this page into Quant, then build on it, backtest it on real data, and keep refining it in conversation.