Concept
Scallop
Scallop is a Chart & Candlestick Patterns concept. The Library holds 1 implementation, a working definition you can pull into Quant.
ascending/descending
Top Scallop indicator
The top custom implementation, built on the original standard Scallop formula.
1 total
Want to trade Scallop? The implementation below is one prompt away from a backtested strategy in Quant.
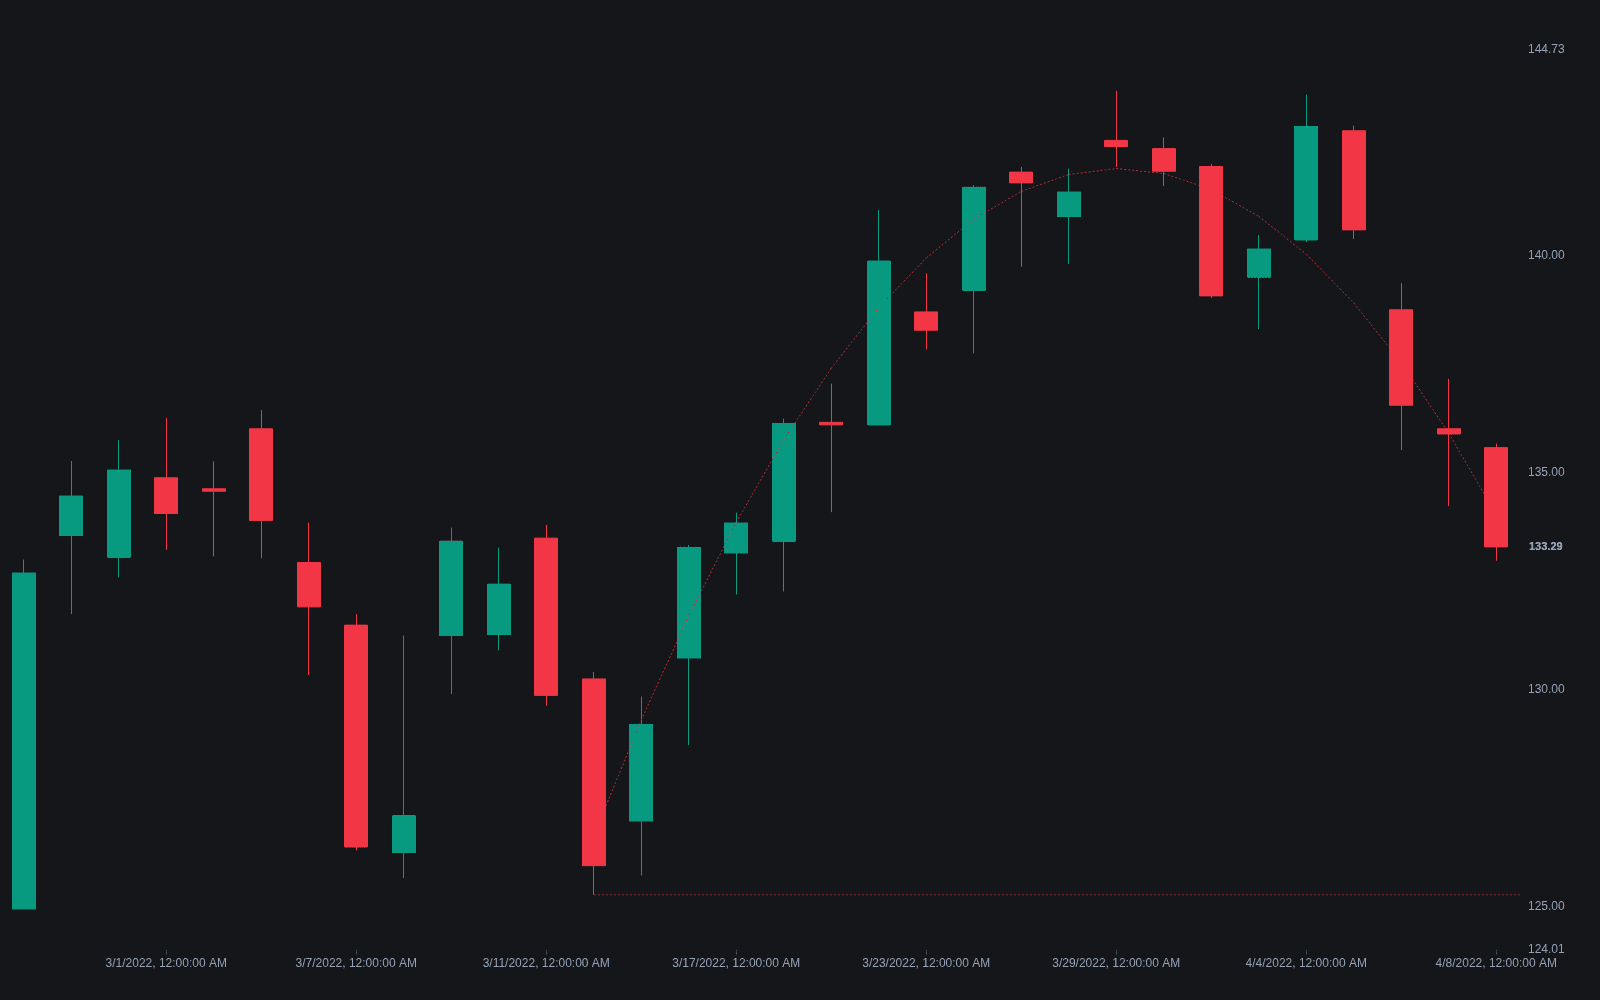
What is a Scallop?
A scallop is a curved continuation pattern shaped like the letter J or its mirror. The ascending scallop, the bullish form, traces a rounded decline that levels off and curls up into a rise ending above where the curve began; the descending scallop inverts the shape in a downtrend. Scallops typically appear in series, each one lifting (or lowering) price to a new level, so a trend can read as a chain of linked J-curves. The pattern in this catalogued form, with definitions and outcome statistics, comes from Thomas Bulkowski's chart-pattern research.
The shape records a gradual handoff rather than an event. Instead of a sharp correction with a defined boundary, sellers fade progressively along the curve's bottom while buyers rebuild, producing the rounded turn that also characterizes the larger rounding bottom. The scallop is essentially a mid-trend rounding turn, smaller and repeating, rather than a major reversal base.
Two behavioral notes from the pattern research are worth keeping. First, successive scallops in a trend tend to grow shorter and shallower as the trend ages, so a noticeably weaker scallop late in a series hints at exhaustion. Second, the curved form has no clean single boundary line, which makes recognition more subjective than for line-bounded patterns and makes strict backtesting of scallops harder to trust.
How to identify a scallop on a chart
The defining feature is the smooth curve; a V-shaped correction is a different pattern regardless of depth.
- 1Establish the trend context: ascending scallops belong in advances, descending scallops in declines.
- 2Trace the curve: from the starting high (bullish case), price should decline, round off gradually, and curl back up in a recognizable J, without a sharp vertex.
- 3Require the finish: the right side should carry price above the curve's starting point for an ascending scallop, confirming continuation.
- 4Check proportions: typical daily-chart scallops span weeks to a few months, with the curve's depth a modest fraction of its length.
- 5Watch volume: it often follows the curve, heavier at the edges and quieter through the rounded low.
- 6In a series, compare each scallop to the last; shrinking height and depth suggest the trend is maturing.
How traders use it
- Continuation entry on the right lip: traders buy an ascending scallop as price curls up through the curve's starting high, with a stop under the rounded low, treating the completed J as trend confirmation.
- Earlier entry inside the curve: some traders enter as the rounded low visibly turns, accepting more ambiguity in exchange for a better price, often triggered off a discrete signal such as a breakout through a short-term level within the curve.
- Target setting: a common approach projects a fraction of the curve's height above the breakout, in the spirit of the measure rule; Bulkowski's statistics suggest tempering full-height projections, especially late in a trend.
- Trend-age assessment: because successive scallops tend to shrink as a trend matures, comparing the current scallop to earlier ones offers a rough exhaustion gauge, useful for tightening stops even when no exit signal has fired.
- The pattern's main limitation is subjectivity: curves are identified by eye, reasonable chartists disagree on boundaries, and that softness should temper confidence in any precise scallop-based rule.
Scallops vs. other rounded and corrective shapes
Rounding Top/Bottom: A rounding bottom is a large standalone reversal base ending a downtrend; a scallop is a smaller mid-trend curve that repeats in series as a continuation feature.
Cup and Handle: The cup and handle adds a second, smaller pause (the handle) after its rounded curve and is traded as a base breakout; the scallop completes directly off its right lip without a handle.
Bull/bear Flag: A flag is a straight-edged, short corrective drift after a sharp pole; the scallop is a gradual rounded correction with no defined boundary lines and typically a longer duration.
Concept family
Chart & Candlestick Patterns
84 concepts mapped · 84 in the Library
Scallop FAQ
Turn Scallop into a trading strategy.
Take the implementation from this page into Quant, then build on it, backtest it on real data, and keep refining it in conversation.