Concept
Inverse Head & Shoulders
Inverse Head & Shoulders are Chart & Candlestick Patterns concepts. The Library holds 1 implementation, a working definition you can pull into Quant.
Top Inverse Head & Shoulders indicator
The top custom implementation, built on the original standard Inverse Head & Shoulders formula.
1 total
This Inverse Head & Shoulders implementation is strategy-ready: open it in Quant, set your rules, and it backtests automatically.
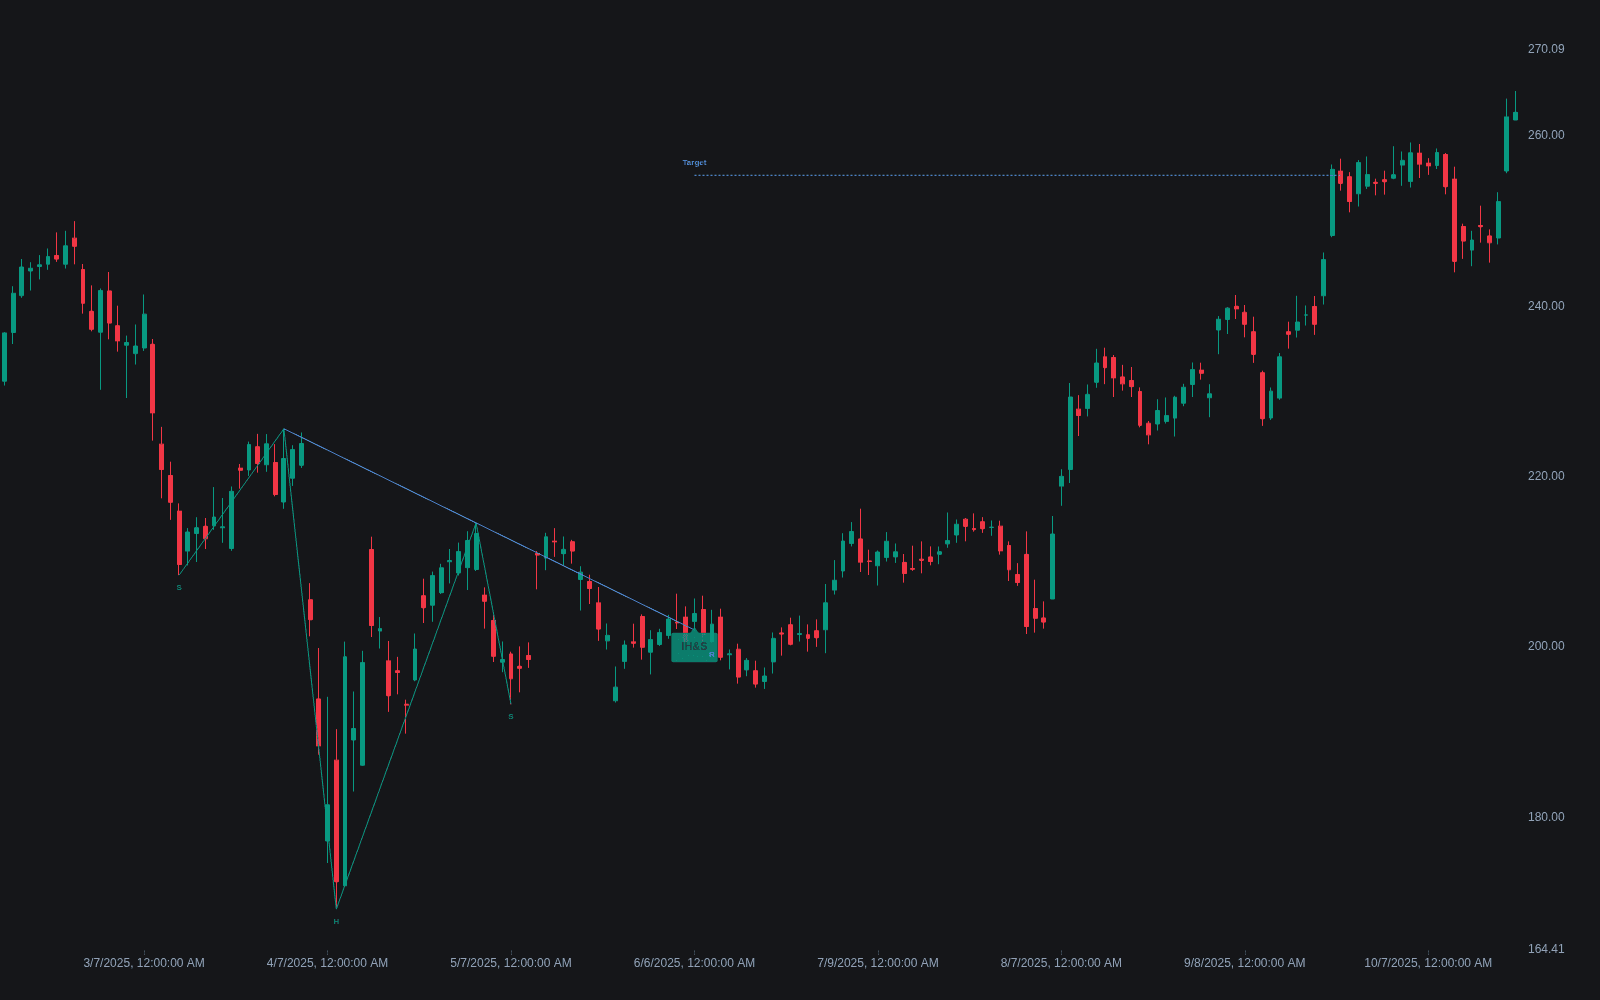
What is an Inverse Head & Shoulders?
The inverse head and shoulders is the bottoming mirror of the head and shoulders top: three troughs, with the middle trough (the head) lower than the two flanking it (the shoulders), and a neckline drawn across the intervening rally highs. The pattern completes when price breaks up through the neckline. It is one of the most widely taught reversal structures in classical charting, standardized in the Edwards and Magee tradition.
The structure encodes a specific failure of a downtrend. The head is the trend's final push to new lows; the right shoulder is the sellers' attempt to resume that push, which halts at a higher low. That higher low is the tell: the supply that drove the trend is no longer being absorbed at ever-lower prices. When buyers then take out the neckline, the sequence of lower highs and lower lows has been fully reversed.
Volume matters more here than in the topping version, a point the classical literature makes explicitly. Because rallies need active buying in a way that declines do not need active selling, chartists conventionally want volume to be relatively subdued into the head, firmer on the rally that forms the right shoulder, and clearly expanding on the neckline breakout. A breakout on listless volume is treated with suspicion.
How to identify an inverse head & shoulders
Work from the lowest low outward, and let the neckline be what the chart gives you, flat or sloped.
- 1Establish a preceding downtrend; without one there is nothing to reverse.
- 2Locate the lowest trough (the head) and a trough on each side that bottoms clearly above it (the shoulders), ideally at roughly similar levels.
- 3Draw the neckline across the two rally highs that separate the troughs; it may slope up or down, and a gently down-sloping neckline triggers earlier.
- 4Check the volume template: lighter on the head's decline than the left shoulder's, then expanding on the right-side rally and the breakout.
- 5Confirm completion only on a decisive close above the neckline; many traders also accept a successful retest of the line from above as a second entry.
- 6Invalidate the pattern if price closes below the right shoulder low, and abandon the bottoming case entirely below the head.
How traders use it
- Breakout entry with a measured objective: buy the neckline break, stop under the right shoulder, and project the head-to-neckline height upward from the break via the measure rule.
- Retest entry: because upside breakouts frequently pull back, many traders prefer buying the return to the neckline, which improves the entry price at the risk of missing runners that never look back.
- Volume as a filter: requiring expanding volume on the breakout is the classical defense against failed breaks, though it filters out some valid moves, particularly in markets where volume data is fragmented.
- Early positioning: aggressive traders buy the right shoulder itself, anticipating the neckline break with a stop under the head; the reward is a far better entry, the cost is acting on an unconfirmed pattern.
- Honest limitation: the pattern appears constantly to eyes looking for it, and most three-trough wiggles are not reversals; insisting on a real prior downtrend and a decisive break removes most of the noise.
Inverse H&S vs. other bottoming patterns
Double top/bottom: A double bottom has two troughs at roughly the same level; the inverse H&S has a middle trough distinctly below its neighbors, which gives it a built-in higher low the double bottom lacks.
Triple top/bottom: A triple bottom's three troughs sit at about the same depth; if the middle trough is clearly the lowest, the structure reads as an inverse H&S instead.
Complex H&S: The complex variant adds extra shoulders or a double head to the same underlying structure, and it occurs at bottoms as well as tops.
Concept family
Chart & Candlestick Patterns
84 concepts mapped · 84 in the Library
Inverse Head & Shoulders FAQ
Turn Inverse Head & Shoulders into a trading strategy.
Take the implementation from this page into Quant, then build on it, backtest it on real data, and keep refining it in conversation.