Concept
Pennant
Pennant is a Chart & Candlestick Patterns concept. The Library holds 1 implementation, a working definition you can pull into Quant.
Top Pennant indicator
The top custom implementation, built on the original standard Pennant formula.
1 total
Want to trade Pennant? The implementation below is one prompt away from a backtested strategy in Quant.
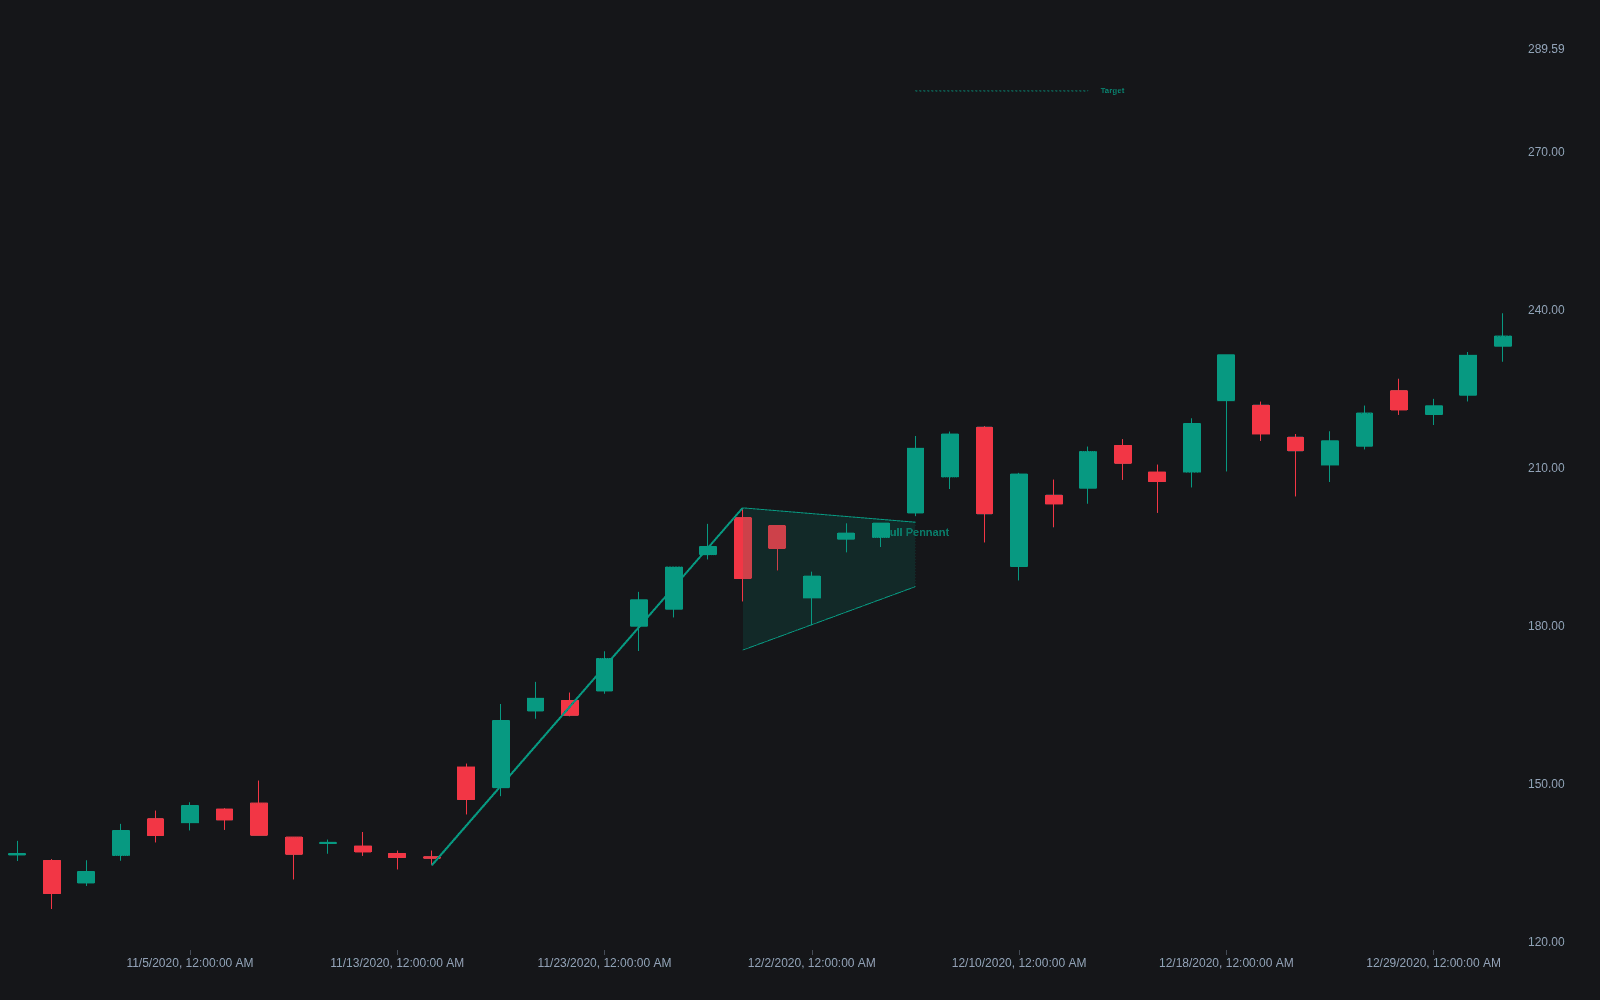
What is a Pennant?
A pennant is a brief continuation pattern: a sharp, near-vertical move (the pole) followed by a small consolidation whose boundaries converge, forming a compact triangle that slopes gently against the move or sits flat. A breakout in the pole's direction completes the pattern. Pennants belong to the classical charting canon alongside flags, with the pair described in Edwards and Magee's Technical Analysis of Stock Trends as among the more dependable short-term continuation formations when strictly defined.
The pattern records digestion after urgency. The pole is initiative, one-sided activity; the pennant is the brief argument that follows, with each rotation smaller than the last as countertrend interest fails to gain ground. Converging boundaries distinguish it from the flag, whose boundaries stay parallel, and the small scale distinguishes it from a full symmetrical triangle, which is a larger structure needing multiple touches per side and no mandatory pole.
Convention cares about proportion and time. A pennant should be small relative to its pole, typically consuming days to about three weeks on daily charts, and should give back only a modest fraction of the pole. Volume conventionally surges on the pole, contracts through the pennant, and expands again on the break; a pennant forming on heavy volume is conventionally suspect, since digestion should be quiet.
How to identify a pennant on a chart
No pole, no pennant; the converging pause only means something as a rest inside an urgent move.
- 1Find the pole: a steep, fast move that stands out from the surrounding price action.
- 2Find the consolidation: a small coil with converging upper and lower boundaries, flat or tilted slightly against the pole.
- 3Check proportion: the pennant should be brief, typically under about three weeks on dailies, and shallow relative to the pole.
- 4Check volume: heavy on the pole, contracting through the pennant, expanding on the breakout.
- 5The trigger is a decisive close through the pennant boundary in the pole's direction.
- 6Treat a break against the pole, or a consolidation that grows to rival the pole in size, as the pattern failing.
How traders use it
- Continuation entry: enter on the breakout through the pennant boundary in the pole's direction, with invalidation on acceptance back inside the coil or beyond its far side.
- Targeting by the flagpole method: project the pole's length from the breakout point, the flag-and-pennant version of the measure rule, with partial targets respected since full completion is a tendency, not a promise.
- Momentum-trading tactics: because pennants mark trend resumption in fast movers, they suit traders adding to winners; the pennant low (in an upmove) provides a natural stop for added size.
- Failure awareness: pennants against the higher-timeframe trend, pennants forming on expanding volume, and pennants that drift too long all fail at elevated rates, and a false breakout through the coil boundary is the classic trap to plan for.
Pennant vs. adjacent patterns
Bull/bear Flag: Flags and pennants are the same event with different geometry: a flag's consolidation runs between parallel boundaries, a pennant's boundaries converge. Trading treatment is essentially identical.
Ascending/descending/symmetrical Triangle: A symmetrical triangle is a larger, slower structure requiring multiple touches per side and carrying no pole requirement; a pennant is a small coil defined by the sharp move preceding it.
High Tight Flag: The high tight flag is a specific weekly-chart stock pattern demanding a near-doubling before the pause; an ordinary pennant follows an impulse of any size on any timeframe.
Concept family
Chart & Candlestick Patterns
84 concepts mapped · 84 in the Library
Pennant FAQ
Turn Pennant into a trading strategy.
Take the implementation from this page into Quant, then build on it, backtest it on real data, and keep refining it in conversation.