Concept
Volume Signature per Pattern
Volume Signature per Pattern is a Chart & Candlestick Patterns concept. The Library holds 1 implementation, a working definition you can pull into Quant.
Top Volume Signature per Pattern indicator
The top custom implementation, built on the original standard Volume Signature per Pattern formula.
1 total
The Volume Signature per Pattern implementation below can become a backtested trading strategy — describe your rules and Quant writes the code.
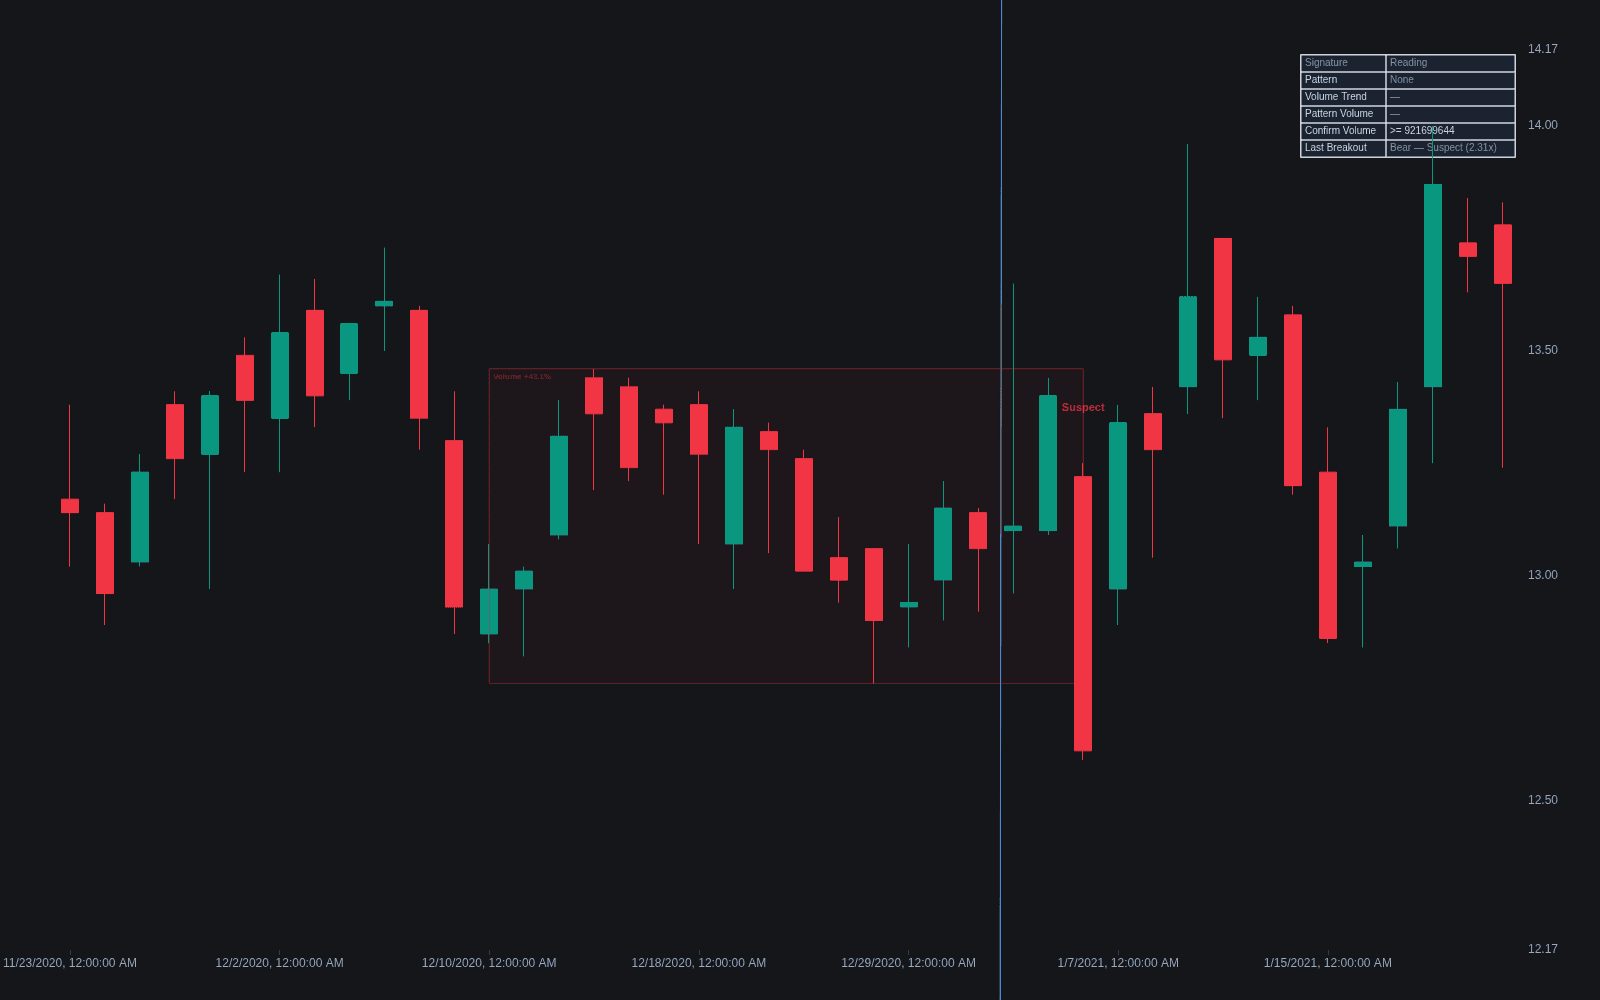
What is Volume Signature per Pattern?
Volume signature per pattern is the classical-charting idea that every chart pattern has an expected volume shape, and that the pattern is only textbook when volume cooperates. In the account running from Edwards and Magee through modern pattern catalogues, a head and shoulders builds on progressively lighter volume across its three peaks, triangles and flags dry up as price coils, and the resolving break arrives on a clear expansion. Price defines the pattern's geometry; volume records who participated while it was drawn.
The signature works as an audit. When observed volume matches the expected shape, the pattern is taken at face value; when it diverges (a breakout on shrinking volume, or heavy churn where quiet contraction was expected), classical charting downgrades the pattern. It is a confidence filter rather than a verdict: patterns with perfect signatures still fail, and volume readings from thin or fragmented venues can mislead.
The catalog extends across the pattern zoo. A double top wants its second peak lighter than the first, evidence the returning rally recruited fewer participants; wedges and triangles want participation draining steadily into the apex; flags want a heavy-volume pole followed by a quiet drift; and climax reversals invert the logic entirely, wanting maximum volume at the extreme, the Livermore-era one-day reversal printing a fresh high on enormous turnover while closing near the lows, the signature of a crowd buying the top from stronger hands. Each shape encodes the same question: did participation behave the way this pattern's story requires?
The rationale is effort versus result, applied over a pattern's whole life rather than one bar, and the modern caveats are real: volume is fragmented across venues in equities and crypto, distorted by passive and algorithmic flow, and absent entirely in spot FX, so signatures read best against relative baselines from a consistent feed. Published pattern statistics generally find that volume-confirmed breaks perform somewhat better on average, with the effect varying by pattern and plenty of exceptions, which supports the classical practice of treating the signature as a weighting input. Tools like Zeenobit's Volume Based Price Action automate the per-bar grading that feeds such audits.
How to identify a pattern's volume signature
The audit has two halves: know what the pattern's textbook signature is, then check whether the tape supplied it.
- 1State the expectation first: contraction into an apex, fading peaks, a heavy pole and quiet flag, or a climax at the extreme, depending on the pattern in question.
- 2Establish a baseline: a volume moving average or relative-volume measure, since raw bars mean nothing without context.
- 3Audit the formation phase: did participation actually drain, fade, or concentrate the way the pattern's story requires?
- 4Audit the resolution: the boundary break should print clear expansion above the recent baseline; note gaps and closing strength as supporting evidence.
- 5Grade the whole: matching signature earns full weight, a mismatch earns reduced size or an added confirmation requirement such as a successful retest.
How traders use it
- As a validity check before entry: confirming that volume contracted while the pattern formed and expanded at the boundary break (volume at breakout) before treating the pattern as complete.
- As an early warning on breakouts: a boundary break on unremarkable volume is treated as more likely to be a false move, so traders wait for a retest or added confirmation instead of chasing it.
- As a tiebreaker: when several patterns compete on the same chart, the one whose volume shape matches its textbook signature gets priority.
- As a climax detector: the one-day reversal signature, a fresh extreme on climactic volume with a close back near the opposite end of a wide-range bar, is monitored as a standalone exhaustion warning even when no larger pattern frames it.
- At bar scale: the same audit applies to candlestick patterns, where an engulfing or hammer printed on expanded volume carries the participation evidence its quiet twin lacks, extending the signature idea from weeks-long geometry down to single sessions.
Volume signatures vs related volume reads
Volume at Breakout: Breakout volume is one frame of the film: participation at the moment the boundary gives. The signature is the whole reel, formation and resolution together. A textbook break after a wrong-shaped formation still fails the audit, which is information the single frame cannot supply.
Candlestick Patterns: Candlestick reads are bar-scale signatures: single sessions of rejection or engulfment, with volume as the optional witness. Pattern signatures stretch the same participation logic across weeks of structure. The scales nest naturally, a volume-backed reversal candle often firing inside a larger pattern's completion.
Wide-range Bar: A wide-range bar is a raw effort event, one session of outsized range and usually volume. The signature framework gives such bars their meaning by location: as a pole starting a flag, a climax ending a trend, or the expansion resolving a coil, the same bar reads differently in each.
Concept family
Chart & Candlestick Patterns
84 concepts mapped · 84 in the Library
Volume Signature per Pattern FAQ
Turn Volume Signature per Pattern into a trading strategy.
Take the implementation from this page into Quant, then build on it, backtest it on real data, and keep refining it in conversation.