Concept
Ascending Base
Ascending Base is a Chart & Candlestick Patterns concept. The Library holds 1 implementation, a working definition you can pull into Quant.
Top Ascending Base indicator
The top custom implementation, built on the original standard Ascending Base formula.
1 total
Want to trade Ascending Base? The implementation below is one prompt away from a backtested strategy in Quant.
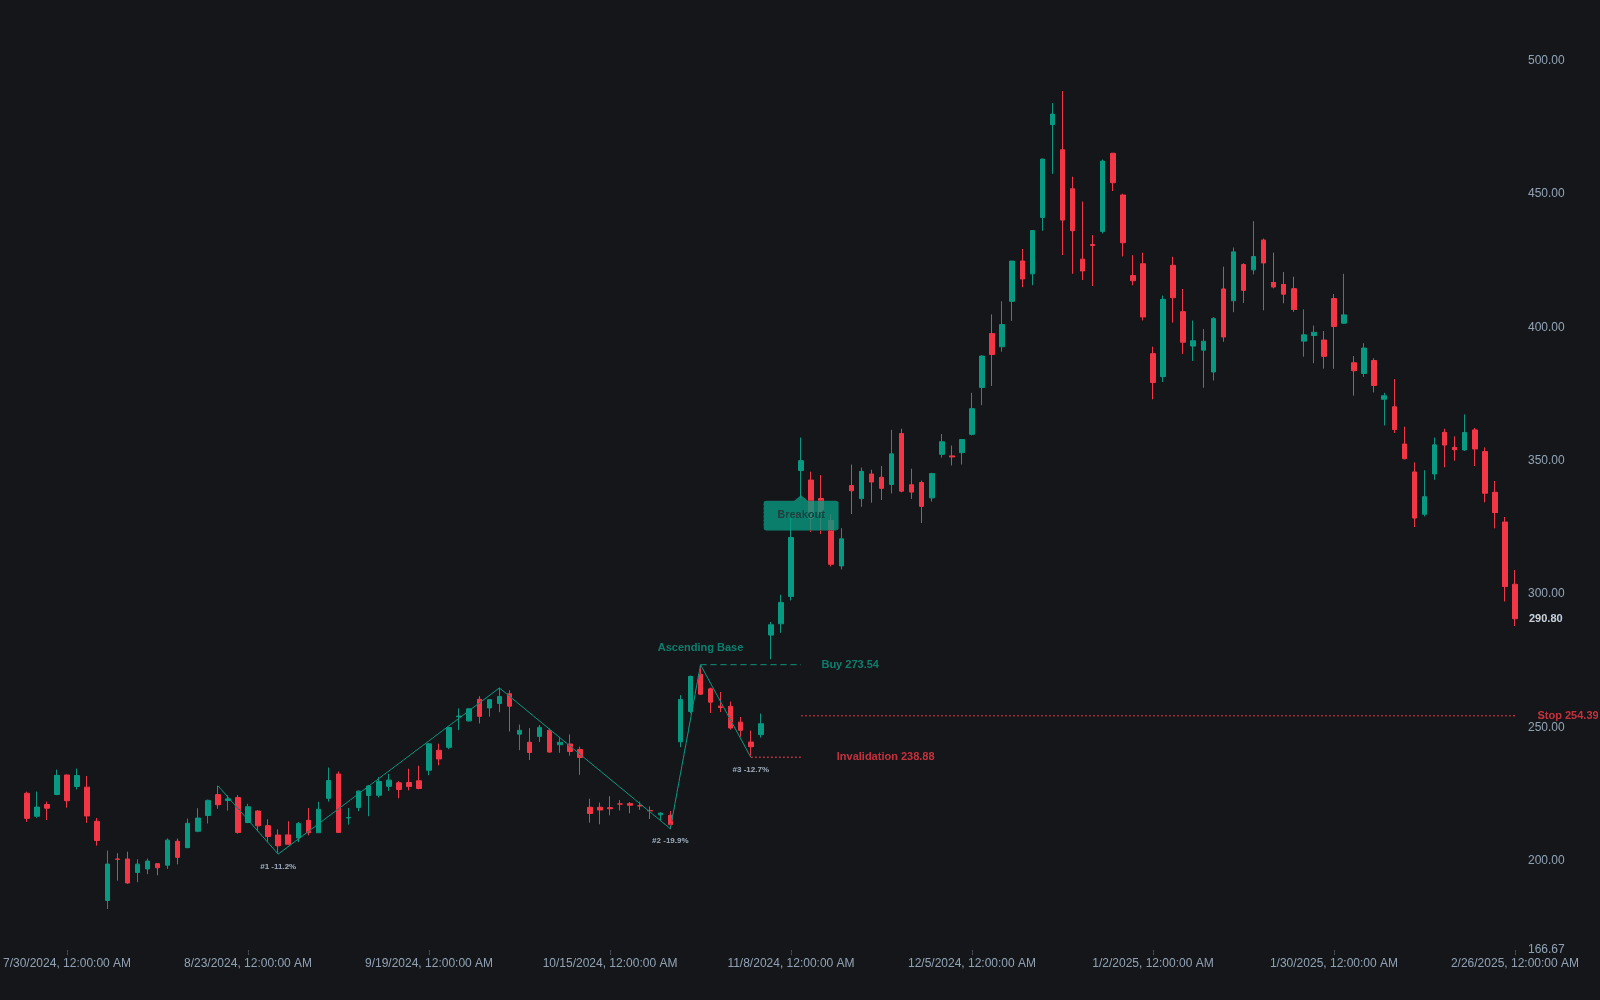
What is an Ascending Base?
An ascending base is a growth-stock consolidation from the base taxonomy developed by William O'Neil and Investor's Business Daily. It forms when a leading stock in an uptrend absorbs a choppy general market by pulling back three times, each pullback moderate, and each low and high stepping above the last. The stock keeps getting knocked down by market weakness and keeps recovering to higher ground, which is exactly the behavior of a name under persistent accumulation.
The IBD specification looks for three pullbacks of roughly 10 to 20 percent each, higher lows from one pullback to the next, and a total structure that commonly takes on the order of nine to sixteen weeks to form. The buy point sits just above the high of the third pullback, and a valid breakout through it is expected to come on volume meaningfully above average, consistent with the rules of O'Neil base analysis generally.
Traders care because the pattern is a relative-strength statement. A stock that makes higher lows while the index makes lower ones is outrunning its market, the same evidence a relative strength comparative line makes explicit. The ascending base is rarer than the flat or cup varieties and, in IBD's telling, tends to appear mid-advance in true leaders, though like every base it fails often enough that the stop discipline matters as much as the pattern.
How to identify an ascending base on a chart
Count the pullbacks and check that each one bottoms and tops higher than the last, ideally against a weak general market.
- 1Start with a stock in an established uptrend, usually one that has already broken out of an earlier base.
- 2Find three distinct pullbacks, each retracing roughly 10 to 20 percent from its local high; much deeper corrections point to a different pattern.
- 3Verify the staircase: each pullback's low undercuts nothing, sitting above the prior pullback's low, and each recovery high exceeds the prior high.
- 4Check the market backdrop; the pattern is most convincing when the pullbacks coincide with general market weakness the stock keeps shrugging off.
- 5Mark the buy point just above the peak of the third pullback and require expanding volume on the move through it, per standard breakout confirmation practice.
- 6Distrust sloppy versions: wide, loose swings with overlapping structure and no volume contraction are noise, not an ascending base.
How traders use it
- Entry timing in leaders: growth traders buy the move through the third-pullback high, treating the pattern as a mid-trend continuation entry rather than a bottom-fishing setup.
- Market-versus-stock read: the pattern is used to shortlist names showing unusual resilience, since three higher lows against a falling index is direct evidence of institutional demand.
- Risk placement: the most recent higher low gives a natural invalidation level, and IBD-style traders additionally cap losses with a fixed percentage stop below the buy point.
- Position adding: because it appears mid-advance, the ascending base often serves as a follow-on buy point for a position initiated from an earlier base, subject to the later-base risk caveats of base counting.
- With limits acknowledged: the pattern is uncommon, easy to force onto ordinary choppy uptrends, and its three-pullback symmetry is only obvious in hindsight, so strict measurement discipline is what separates it from wishful line drawing.
Ascending base vs. neighboring bases
Flat Base: A flat base drifts sideways in a tight range of limited depth; an ascending base makes three distinct pullbacks that each resolve to higher ground.
Cup-with-handle Base: The cup with handle is a single rounded correction with one shakeout before the buy point; the ascending base is three stacked corrections with rising floors.
High Tight Flag: Both are rare continuation patterns in strong stocks, but the high tight flag follows a near-vertical advance and corrects very shallowly, while the ascending base absorbs repeated 10 to 20 percent hits.
Concept family
Chart & Candlestick Patterns
84 concepts mapped · 84 in the Library
Ascending Base FAQ
Turn Ascending Base into a trading strategy.
Take the implementation from this page into Quant, then build on it, backtest it on real data, and keep refining it in conversation.