Concept
Flat Base
Flat Base is a Chart & Candlestick Patterns concept. The Library holds 1 implementation, a working definition you can pull into Quant.
Top Flat Base indicator
The top custom implementation, built on the original standard Flat Base formula.
1 total
This Flat Base implementation is strategy-ready: open it in Quant, set your rules, and it backtests automatically.
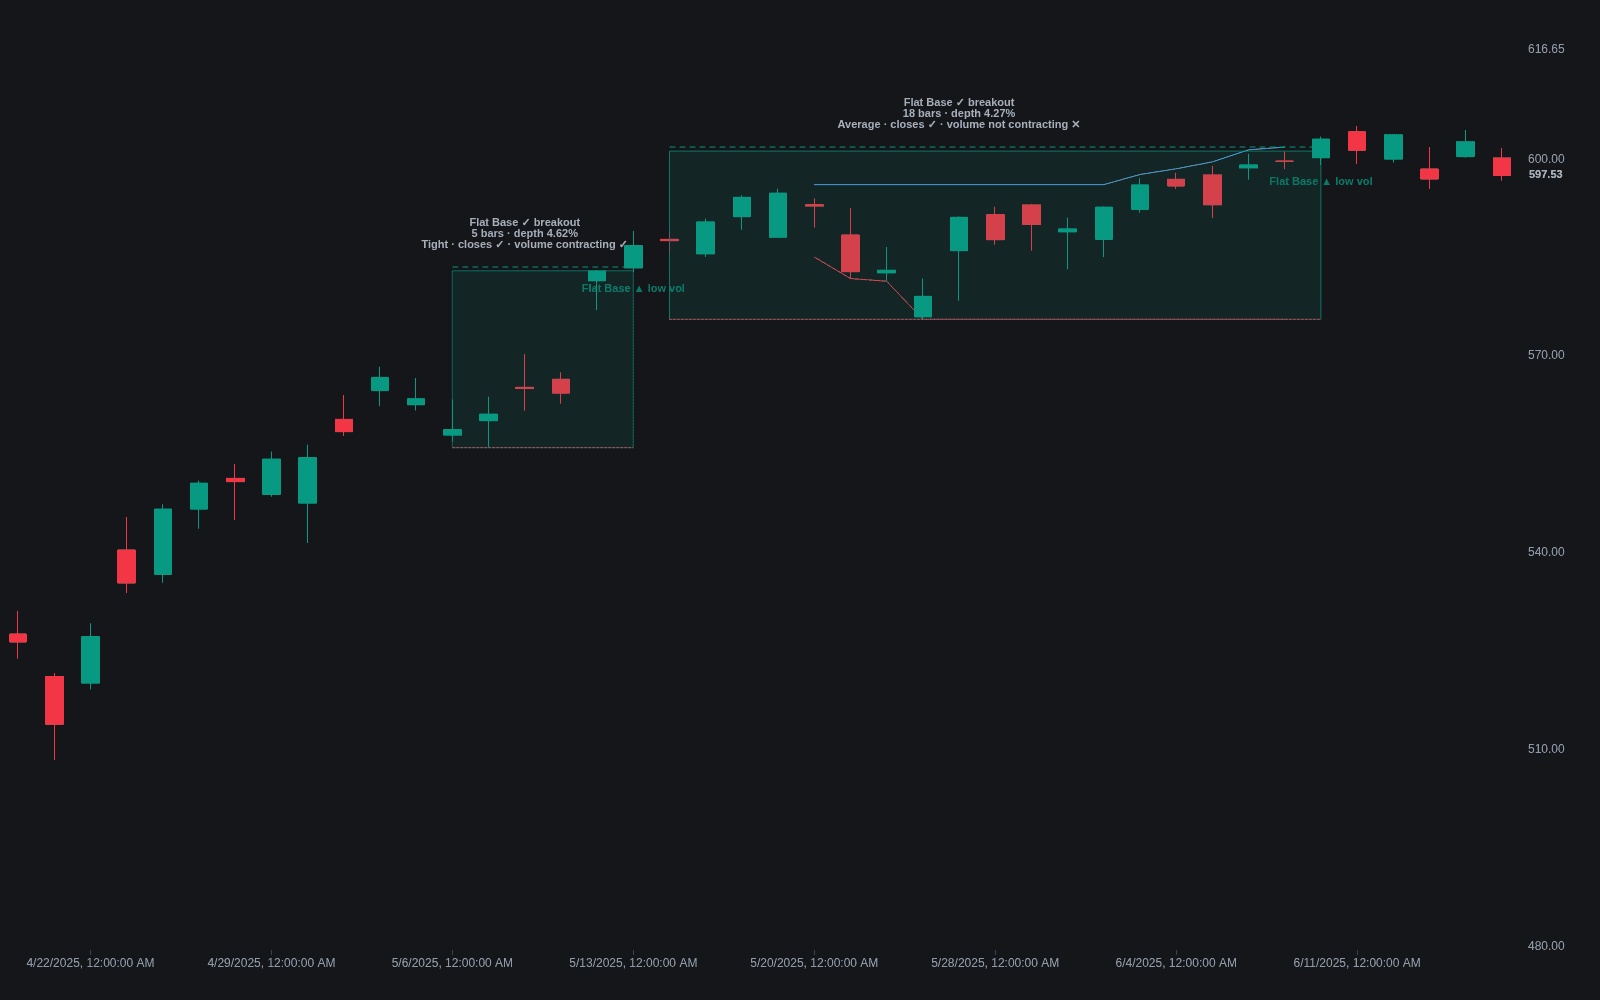
What is a Flat Base?
A flat base is the quietest structure in William O'Neil's base taxonomy: a growth stock that has already advanced simply moves sideways in a tight range instead of correcting deeply. The IBD specification is compact, generally a minimum of about five weeks of sideways trade with a correction of no more than roughly 15 percent from high to low. The stock digests its prior gain through time rather than price, which is often read as holders refusing to sell.
Flat bases characteristically form as second-stage structures. A stock breaks out of a deeper base such as a cup-with-handle base, advances 20 percent or more, and then shelves sideways while its moving averages catch up. Because the pattern requires the stock to resist normal corrective pressure, it is treated within O'Neil base analysis as a strength signal: supply is so thin that price cannot pull back meaningfully.
Traders care because tightness is information. A narrow, low-volatility shelf near highs means sellers are inactive and any new demand must pay up, which is why the eventual breakout from a genuine flat base can travel quickly. The same logic underlies related compression ideas like the volatility contraction pattern; the flat base is the O'Neil-taxonomy expression of it, with explicit depth and duration rules.
How to identify a flat base on a chart
Weekly charts show the shelf best; the two numbers to check are depth and duration.
- 1Start with a stock in an uptrend, ideally one that has gained on the order of 20 percent or more from a prior base breakout.
- 2Find a sideways range lasting at least about five weeks; shorter shelves have not proven anything yet.
- 3Measure the depth: the correction from the range high to the range low should not exceed roughly 15 percent.
- 4Prefer tight weekly closes within the range and contracting volume, evidence that shares are being held rather than distributed.
- 5Mark the pivot just above the high of the range and require volume expansion well above average on the move through it.
- 6Downgrade wide-and-loose versions: a 15 percent range full of wild weekly swings meets the letter of the rule while failing its spirit.
How traders use it
- Add-on entries: because flat bases usually form after an earlier breakout has worked, they commonly serve as the buy point for adding to an existing winner rather than initiating cold.
- Compression trading: the tight range gives an unusually close invalidation, so traders can structure entries at the pivot with stops under the range low or the standard fixed percentage, whichever is nearer.
- Strength screening: names shelving sideways while the general market corrects show relative strength, and screens for tight multi-week ranges near highs surface candidates before the breakout.
- Base-count context: a flat base after one prior base is early in an advance; the same shelf appearing as a fourth structure is late, and base counting downgrades its odds accordingly.
- With limits: flat bases in thin stocks break out falsely with some regularity, quiet ranges can resolve downward when the general market rolls over, and the pattern's simplicity makes it easy to over-identify.
Flat base vs. lookalike structures
Rectangle: A rectangle is the generic classical range pattern on any instrument, tradable in either direction; the flat base adds growth-stock context, depth and duration limits, and an upward resolution thesis.
Ascending Base: The ascending base makes three distinct 10 to 20 percent pullbacks with rising lows; a flat base stays much shallower and simply drifts sideways.
Cup-with-handle Base: The cup is a deeper, longer correction with a rounded low and a handle shakeout; the flat base skips the correction almost entirely, which is precisely its message.
Concept family
Chart & Candlestick Patterns
84 concepts mapped · 84 in the Library
Flat Base FAQ
Turn Flat Base into a trading strategy.
Take the implementation from this page into Quant, then build on it, backtest it on real data, and keep refining it in conversation.