Concept
High-wave Candle
High-wave Candle is a Chart & Candlestick Patterns concept. The Library holds 1 implementation, a working definition you can pull into Quant.
Top High-wave Candle indicator
The top custom implementation, built on the original standard High-wave Candle formula.
1 total
Want to trade High-wave Candle? The implementation below is one prompt away from a backtested strategy in Quant.
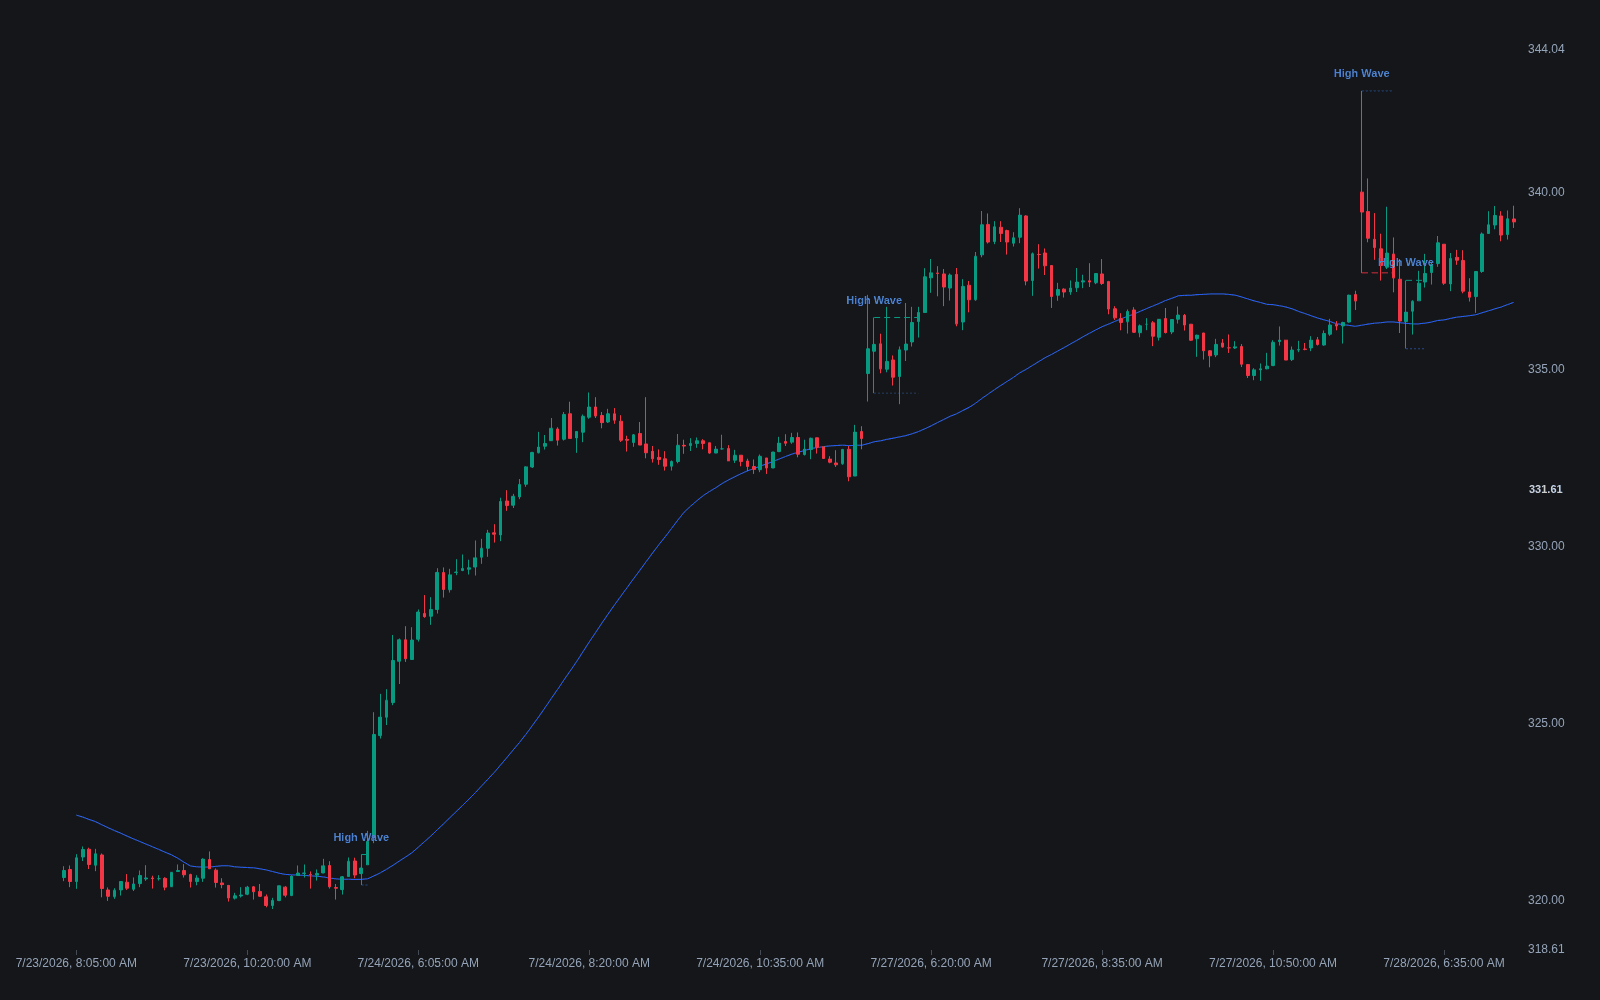
What is a high-wave candle?
A high-wave candle is a single candle with unusually long shadows on both sides and a small real body near the middle of the range. The session traveled far above and far below its open, and closed near where it started. The name comes from the Japanese image of a market tossed by high waves: enormous intrasession range, no net progress.
The candle is the loud sibling of the spinning top. A spinning top shows mild two-sided trade with modest shadows; a high-wave candle shows violent two-sided trade, with both an upward excursion and a downward excursion that were each fully rejected. When the body shrinks to nothing the candle becomes a long-legged doji, and in practice the three labels form a continuum of indecision measured by shadow length and body size.
Traders care because high-wave candles mark a collapse of consensus at high energy. After a sustained trend they often accompany climactic conditions, where late participants chase, early participants exit, and price whips both ways; at those locations they are watched as possible exhaustion. Inside a range they mostly record event noise, news sessions, or thin liquidity, and carry less directional information. Like everything in the candlestick catalog, the candle describes what happened, not what happens next.
How to identify a high-wave candle on a chart
The defining features are relative, so recent bars set the yardstick.
- 1Look for shadows that are long on both sides of the body, each typically well over the body's height and large relative to recent bars' ranges.
- 2Require a small real body positioned somewhere near the middle of the total range; color is essentially irrelevant.
- 3Distinguish it from one-sided rejection candles: a hammer or shooting-star shape has one dominant shadow, while the high wave has two.
- 4Weigh context: after an extended trend or into a key level, the candle suggests exhaustion or a fight for control; mid-range or on news, it is often just volatility.
- 5Check volume: high volume with no net progress strengthens the reading that large opposing flows met and neutralized each other.
How traders use it
- As an exhaustion flag: a high-wave candle after a long directional run warns trend followers that two-sided trade has arrived, a common cue to tighten stops or reduce size rather than to reverse outright.
- As a volatility alert: the expanded range itself is information, often preceding further wide-range sessions, so short-term traders widen stops or stand aside until direction resolves.
- As a breakout reference: some traders treat the high-wave candle's extremes as a bracket and trade the eventual close beyond one side, on the logic that the fight recorded inside the bar has then been decided.
- With honest limits: the candle is common around news and in thin sessions, where it means little, and it gives no directional edge by itself. Its role is to mark where conviction failed, not to say which side wins.
High-wave candle vs neighboring indecision candles
Spinning top: Both have small bodies and shadows on both sides, but the spinning top's shadows are modest while the high wave's are exceptionally long; the difference is the amount of energy spent achieving nothing.
Doji: A doji is defined by open and close being essentially equal, regardless of shadow length; a high-wave candle keeps a small body. A long-legged doji is effectively a high-wave candle with the body squeezed to zero.
Wide range bar: A wide range bar shares the expanded range but typically closes near one extreme, expressing resolution; the high-wave candle closes near the middle, expressing stalemate.
Concept family
Chart & Candlestick Patterns
84 concepts mapped · 84 in the Library
High-wave Candle FAQ
Turn High-wave Candle into a trading strategy.
Take the implementation from this page into Quant, then build on it, backtest it on real data, and keep refining it in conversation.