Concept
Piercing Line
Piercing Line is a Chart & Candlestick Patterns concept. The Library holds 1 implementation, a working definition you can pull into Quant.
Top Piercing Line indicator
The top custom implementation, built on the original standard Piercing Line formula.
1 total
The Piercing Line implementation below can become a backtested trading strategy — describe your rules and Quant writes the code.
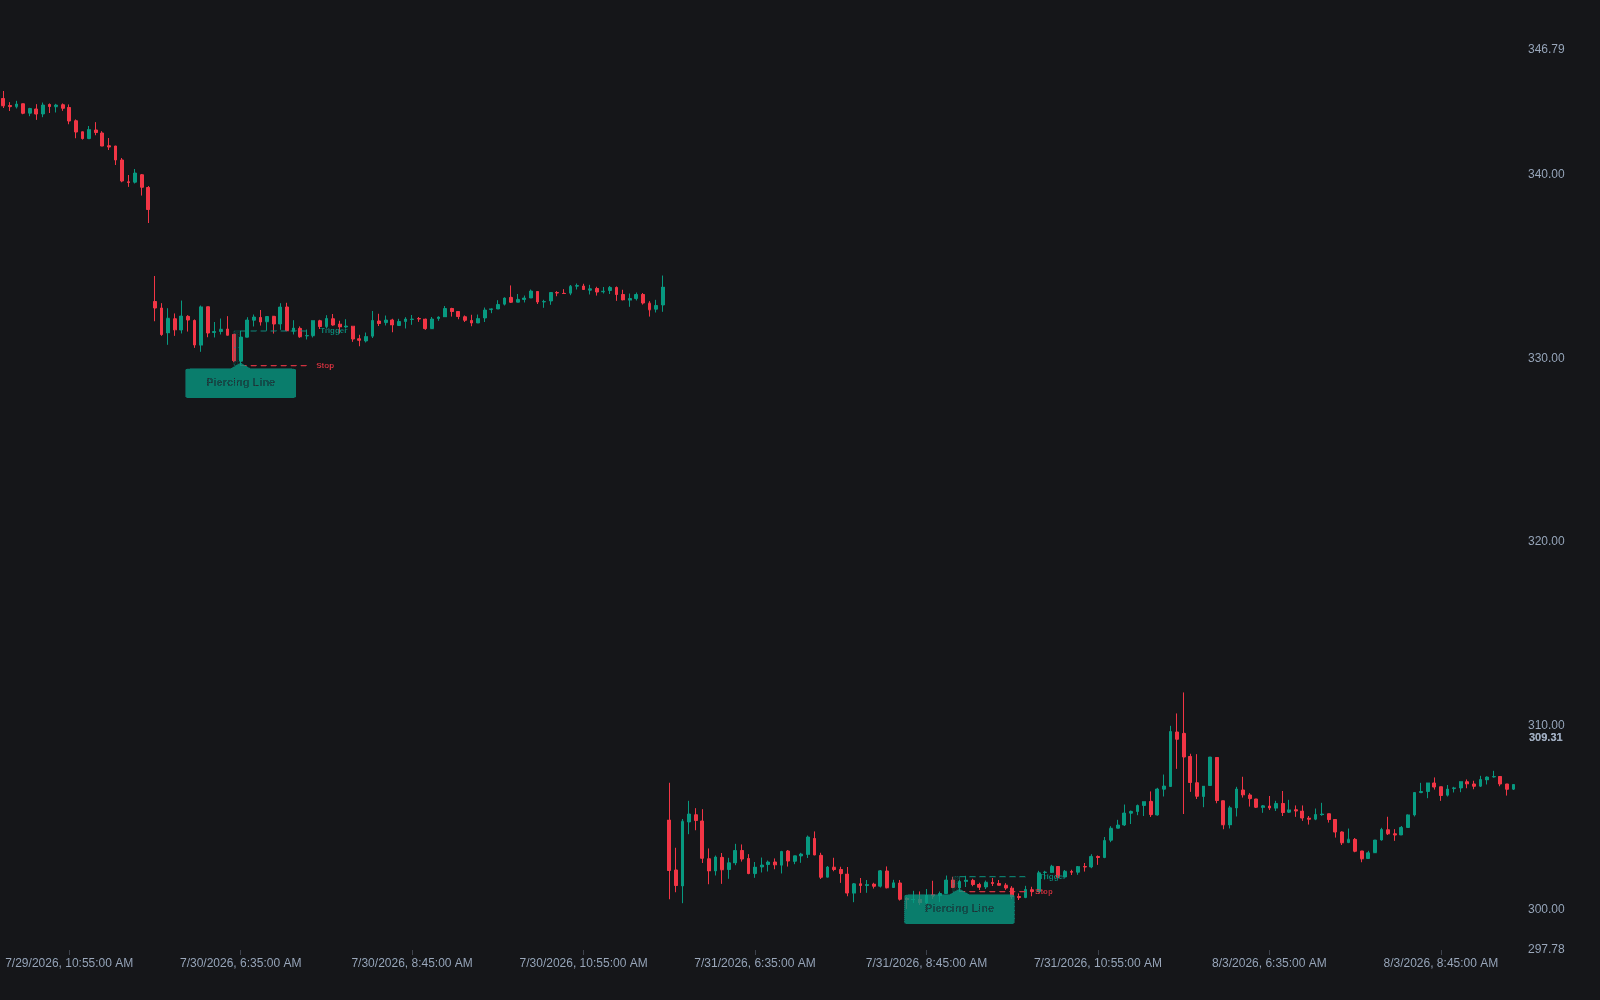
What is a Piercing Line?
A piercing line is a two-candle bullish reversal pattern from the Japanese candlestick catalog. After a decline, the first candle is a long bearish body; the second opens below the first candle's close (the strict classical form asks for an open below its low) and then closes inside the first body, above its midpoint but below its open. The mechanism is the recovery: sellers get the weak open they positioned for, and buyers reclaim more than half of the prior session's loss anyway.
Depth is the grading criterion. A close short of the midpoint downgrades the pattern to weaker relatives (the thrusting and on-neck lines of the traditional taxonomy), while a close above the first candle's open upgrades it to a bullish engulfing. Its bearish mirror image at the top of an advance is the dark cloud cover.
The pattern reached Western charts through Steve Nison's work translating Japanese candlestick technique in the early 1990s, and it sits inside a graded family the tradition spells out precisely. An on-neck line closes only back at the prior low, an in-neck line barely inside the body, a thrusting line into the body but short of the midpoint, and the piercing line above it; each step of penetration converts more of the seller's win into a draw. The midpoint rule is what makes the piercing line special: reclaiming most of a wide-range down candle in one session is a measurable statement of absorption, part of the broader two-bar reversal family.
The honest performance picture is modest. Published candlestick statistics generally place the piercing line mid-pack among reversal patterns, with results that depend heavily on the trend context and on demanding real confirmation afterward; in continuously traded markets the required gap-down open barely exists, so scanners accept an open below the prior close and the pattern loses part of its original trap logic. Detection tools, like TradingFinder's paired dark-cloud and piercing detector, handle the geometry; the location work, whether the pattern printed at a level that matters, stays with the trader.
How to identify a piercing line
The definition is strict enough to code, which also makes it strict enough to check by hand in a few steps.
- 1Require a preceding decline: the pattern is a bottom-reversal candidate, and the same two candles inside a range or an uptrend carry no message.
- 2First candle: a long bearish real body, evidence the sellers were in control into the close.
- 3Second candle: an open below the first candle's close, ideally below its low in the strict form, giving sellers their follow-through moment.
- 4The close must land above the midpoint of the first candle's body but below its open; deeper is stronger, and above the open becomes an engulfing instead.
- 5Grade and confirm: heavier volume on the recovery candle strengthens the absorption read, and most traders demand the next candle close higher before acting.
How traders use it
- As a reversal trigger at support or after an extended decline, usually with confirmation from the next candle closing higher before acting on it.
- As a strength gauge: the deeper the second candle pierces the first body, the more of the prior selling has been absorbed, so piercing lines are often ranked by penetration depth.
- As a screener condition: the midpoint rule is objective enough to code, which is why the pattern appears in most candlestick pattern scanners.
- As location confirmation: a piercing line printing at a mapped support zone, a prior low, or an oversold extreme is treated as the level answering, while the same candles in open space are routinely skipped.
- For risk framing: the pattern low, the second candle's open or the first candle's low, gives a natural invalidation, with stops beneath it and first targets at the nearest overhead structure.
Piercing line vs related reversal patterns
Bullish Engulfing: Same two-candle logic, different finish line: the engulfing closes above the first candle's open, erasing the whole down day, while the piercing line stops between the midpoint and the open. Engulfing is the stronger single statement; the piercing line fires earlier in the recovery.
Hammer: The hammer compresses rejection into one candle, a long lower wick showing an intrabar failure of the sellers. The piercing line spreads the same story across two sessions, with the recovery confirmed by a close rather than a wick. Wick evidence is faster; close evidence is firmer.
Morning Star: The morning star adds a pause: a long down candle, a small indecision body, then a strong recovery close into the first body. The piercing line is the compressed version without the middle candle. The three-candle form maps the turn in more detail but needs an extra session.
Concept family
Chart & Candlestick Patterns
84 concepts mapped · 84 in the Library
Piercing Line FAQ
Turn Piercing Line into a trading strategy.
Take the implementation from this page into Quant, then build on it, backtest it on real data, and keep refining it in conversation.