Concept
IPO Base
IPO Base is a Chart & Candlestick Patterns concept. The Library holds 1 implementation, a working definition you can pull into Quant.
Top IPO Base indicator
The top custom implementation, built on the original standard IPO Base formula.
1 total
Want to trade IPO Base? The implementation below is one prompt away from a backtested strategy in Quant.
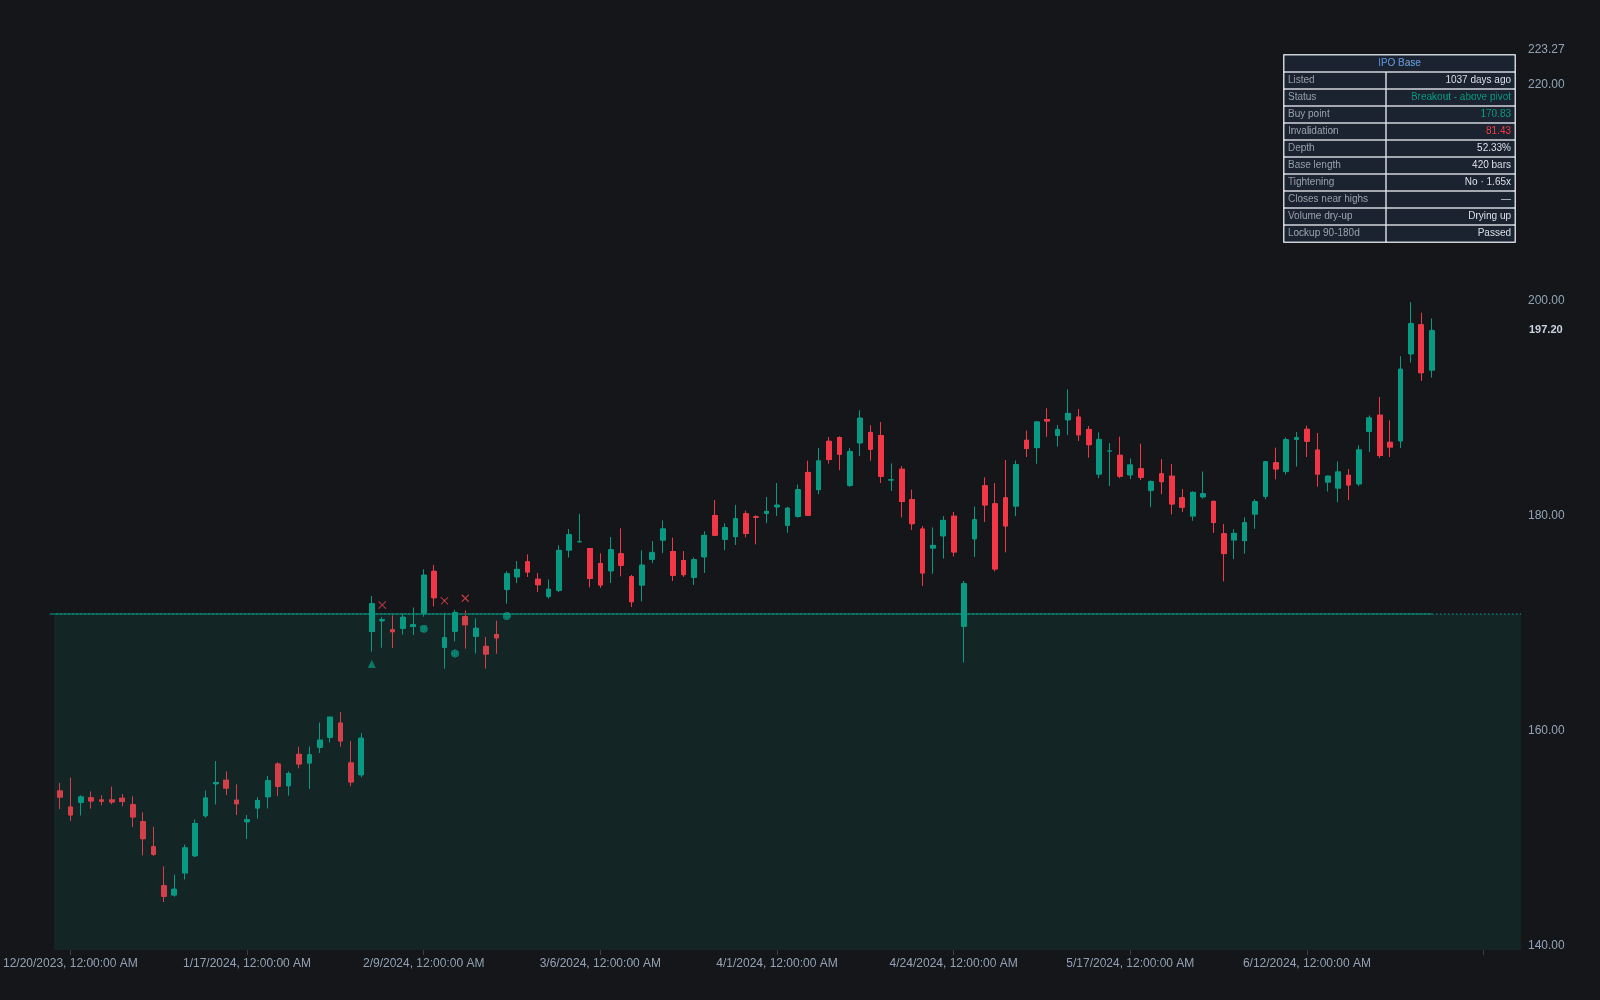
What is an IPO Base?
An IPO base is the first consolidation a newly listed stock forms after its market debut, a pattern named in William O'Neil's base taxonomy. Because a recent IPO has almost no price history, the usual base rules relax: the structure can be shorter than the minimums applied to a cup and handle or flat base, and it is often deeper and more erratic, since there are no established support levels and the public float is typically still thin. The buy point is conventional: the high of the base, taken on a breakout with a clear pickup in volume.
The pattern comes from O'Neil, founder of Investor's Business Daily and author of How to Make Money in Stocks, whose studies of past winners produced a catalog of buyable bases with minimum lengths and depth limits. The IPO base is the deliberate exception for stocks too young to satisfy them: a new issue cannot show the prior uptrend a standard base demands, so that requirement is waived and the minimum length shrinks to a few weeks in IBD's coverage. A commonly cited example is Google, which broke out of its first post-debut range in late September 2004, weeks after listing, before a long advance.
The pattern begins once debut excitement resolves into a range: an initial surge or slide, a defined high, and a pullback that finds a floor. Early action is typically wild, full of wide-range bars and failed pushes, because the float is small and opinion is unanchored. A maturing base tightens: dips get shallower, inside bars appear near the highs, and volume dries up as impatient holders finish selling. The progression matters more than any single candle, though individual candlestick patterns inside the range still color the read.
The trade-off is reliability. With no overhead price history, no long-term moving averages, and lockup expirations ahead, IPO bases are widely treated as riskier than bases in seasoned names. The same lack of history that permits explosive advances also permits severe breaks, so most practitioners treat it as an aggressive setup: smaller size, wider expectations, and no assumption that a first base will hold.
How to identify an IPO base on a chart
The definition is loose by design, so a checklist keeps it honest:
- 1Confirm the stock listed recently, typically within its first year, often its first few months.
- 2Locate the post-debut high and the low of the pullback that followed; that range is the candidate base and can run deeper than a standard base would tolerate.
- 3Look for tightening as the base matures: shallower dips, quieter bars, closes collecting near the range highs.
- 4Watch early gaps: new issues gap often, and the speed of any gap fill shows whether demand or supply is absorbing the other.
- 5Mark the buy point at the base high and the invalidation at the base low, noting the lockup expiration date, since new supply can land mid-pattern.
How traders use it
- As a breakout setup: the entry is the base high, with volume doing the confirming, since a thin-float new issue can clear a level on noise alone; a decisive engulfing bar through the pivot says more than a quiet drift above it.
- As a risk framework: with no prior support history, stops go beneath the base low or a predefined percentage, and position size is cut relative to setups in established stocks.
- As a screening rule: recently listed stocks that have tightened into a definable range near their highs are flagged for watchlists rather than bought blind.
- As a shakeout filter: sharp probes below the range that snap back within a bar or two, often ending in a pin bar or two-bar reversal, are common in thin new issues and read as supply tests, not automatic failure.
- As a patience rule: waiting for the first proper base instead of chasing debut-week momentum, which offers no reference level for defining risk.
IPO base vs other consolidation patterns
Triangles: Both are consolidations resolved by breakout, but triangles are defined by converging boundaries and can form at any age. An IPO base is defined by context: whatever first range a new listing carves out, converging or not.
Double Top/Bottom: A double top or bottom is a reversal structure that needs an established move to reverse. An IPO base has no trend behind it; it is a first act, which is why its rules are looser and failures more frequent.
Concept family
Chart & Candlestick Patterns
84 concepts mapped · 84 in the Library
IPO Base FAQ
Turn IPO Base into a trading strategy.
Take the implementation from this page into Quant, then build on it, backtest it on real data, and keep refining it in conversation.