Concept
On-neck / In-neck / Thrusting
On-neck / In-neck / Thrusting is a Chart & Candlestick Patterns concept. The Library holds 1 implementation, a working definition you can pull into Quant.
Top On-neck / In-neck / Thrusting indicator
The top custom implementation, built on the original standard On-neck / In-neck / Thrusting formula.
1 total
The On-neck / In-neck / Thrusting implementation below can become a backtested trading strategy — describe your rules and Quant writes the code.
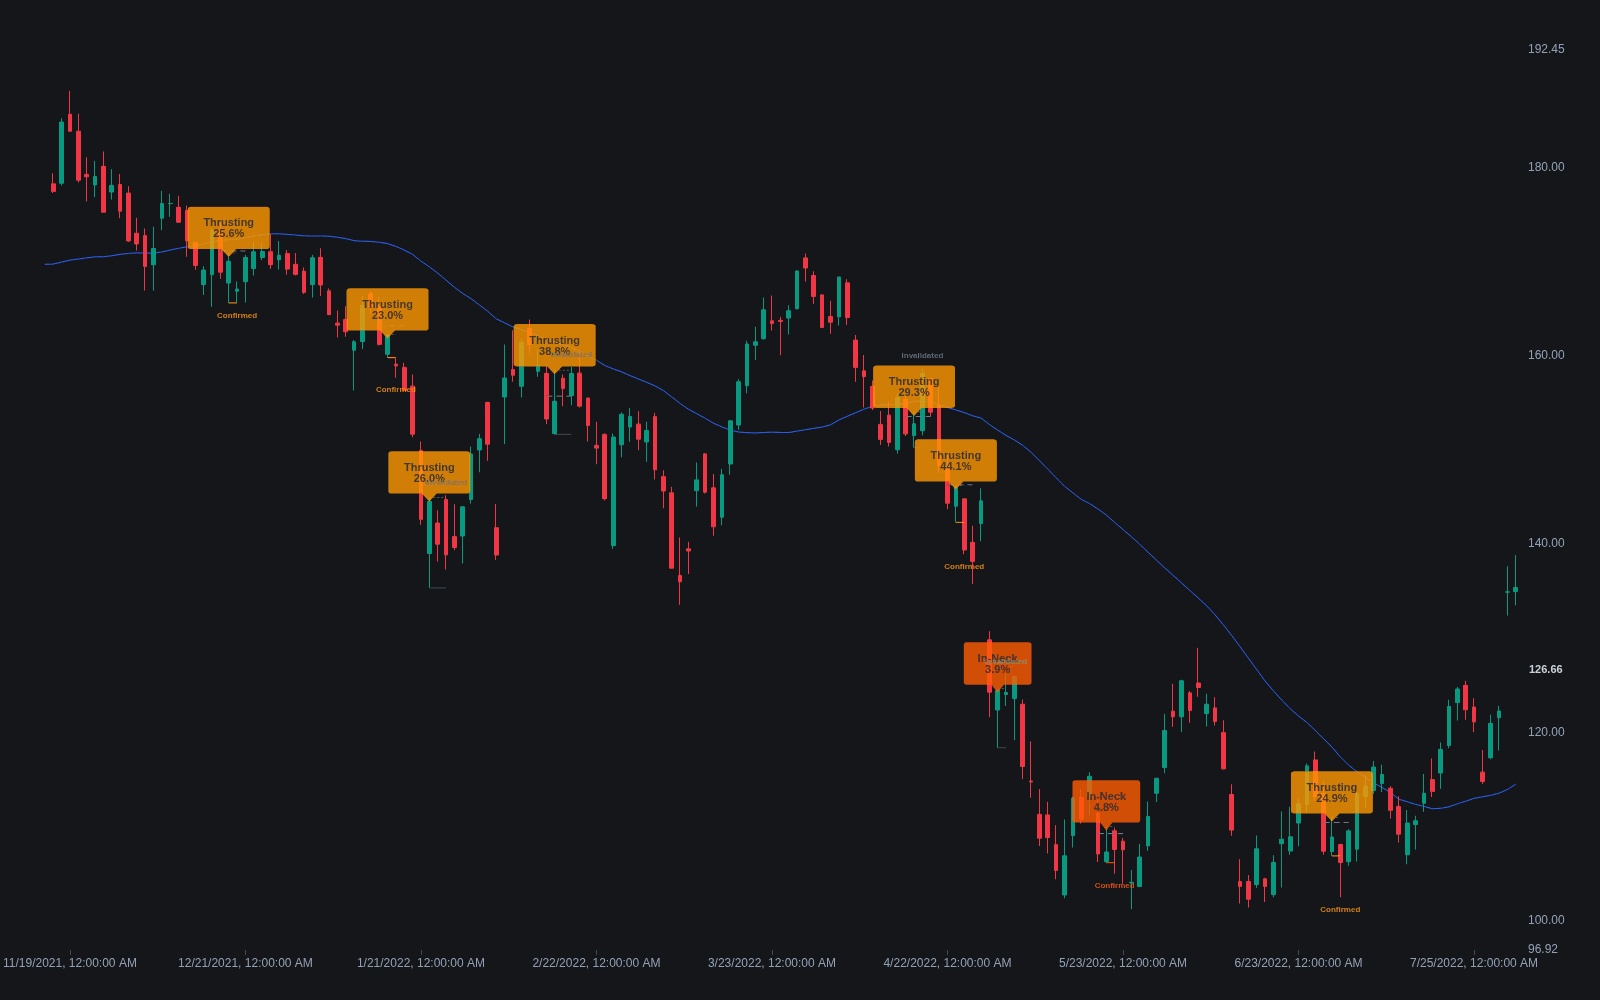
What are the On-neck, In-neck, and Thrusting lines?
On-neck, in-neck, and thrusting are three closely related two-candle patterns from the Japanese candlestick catalog, all describing weak rallies inside a downtrend. Each begins the same way: a long dark candle in a decline, followed by a white candle that opens lower and recovers. What separates them is how far the recovery reaches. The on-neck line closes at or near the first candle's low, barely regaining anything. The in-neck line closes marginally into the first candle's body, just above its close. The thrusting line pushes further into the body but stops short of the midpoint.
All three are classically read as bearish continuation signals. The logic is the failed rally: buyers got a lower open, spent the session recovering, and still could not reclaim even half of the prior candle's loss. The taxonomy is really a depth scale, and it continues upward past these patterns. A close above the midpoint upgrades the formation to the bullish piercing line, and a close above the first candle's open upgrades it again to a bullish engulfing. The three weak variants are what a piercing line looks like when it fails to pierce.
Traders care about the trio mostly as a grading tool. In a downtrend, seeing white candles that repeatedly stall below the midpoint of prior dark bodies is evidence that dip buying lacks force, which supports staying with the trend. The honest caveats: the distinctions between the three are fine enough that scanner tolerances blur them, the patterns are continuation signals with meaningful failure rates like everything else in the catalog, and the thrusting line in particular is described in parts of the literature as capable of bullish implications when it appears repeatedly.
How to identify on-neck, in-neck, and thrusting lines
The setup candle is identical for all three; the classification hangs entirely on the second close.
- 1Confirm a downtrend and a long dark first candle; without the decline these are just adjacent candles.
- 2Require the second candle to open below the first candle's close, ideally below its low in the strict form.
- 3Classify by the second close: at or near the first candle's low is on-neck; slightly above the first candle's close is in-neck; well into the body but below its midpoint is thrusting.
- 4Check the midpoint boundary carefully: a close above it is a piercing line, a different and bullish pattern, so the midpoint is the line that matters most.
- 5Read the resolution: classical continuation is confirmed when price breaks below the second candle's low.
How traders use it
- As continuation evidence in downtrends: any of the three lines after a dark candle suggests the bounce lacked conviction, supporting existing shorts or delaying countertrend longs.
- As a short entry trigger with the classical rule: enter on a break below the pattern's low, with invalidation above the second candle's high, since a push through that high means the weak rally was actually absorbing supply.
- As a depth gauge for dip quality: traders tracking a decline can rank successive bounces on the on-neck to piercing scale, watching for the first rally that clears a midpoint as an early sign the sellers are losing control.
- As a scanner family with tolerance settings: the boundaries between the three patterns are a few ticks wide in liquid markets, so most implementations either merge them or expose a tolerance parameter, and results shift noticeably with that choice.
The weak lines vs their stronger relatives
Piercing line: The piercing line is the same setup with a close above the first body's midpoint, which flips the classical reading from bearish continuation to bullish reversal. The midpoint is the boundary between the families.
Bullish/bearish engulfing: An engulfing close reclaims the entire prior body, the strongest rung of the depth scale; the on-neck, in-neck, and thrusting lines sit at the opposite, weakest end.
Dark cloud cover: Dark cloud cover is the bearish mirror of the piercing line at the top of an advance; the mirror images of the weak lines exist in uptrends too, though the literature names the downtrend versions.
Concept family
Chart & Candlestick Patterns
84 concepts mapped · 84 in the Library
On-neck / In-neck / Thrusting FAQ
Turn On-neck / In-neck / Thrusting into a trading strategy.
Take the implementation from this page into Quant, then build on it, backtest it on real data, and keep refining it in conversation.