Concept
Double-bottom Base
Double-bottom Base is a Chart & Candlestick Patterns concept. The Library holds 1 implementation, a working definition you can pull into Quant.
Top Double-bottom Base indicator
The top custom implementation, built on the original standard Double-bottom Base formula.
1 total
From studying Double-bottom Base to trading it: take the implementation below into Quant and backtest it instantly.
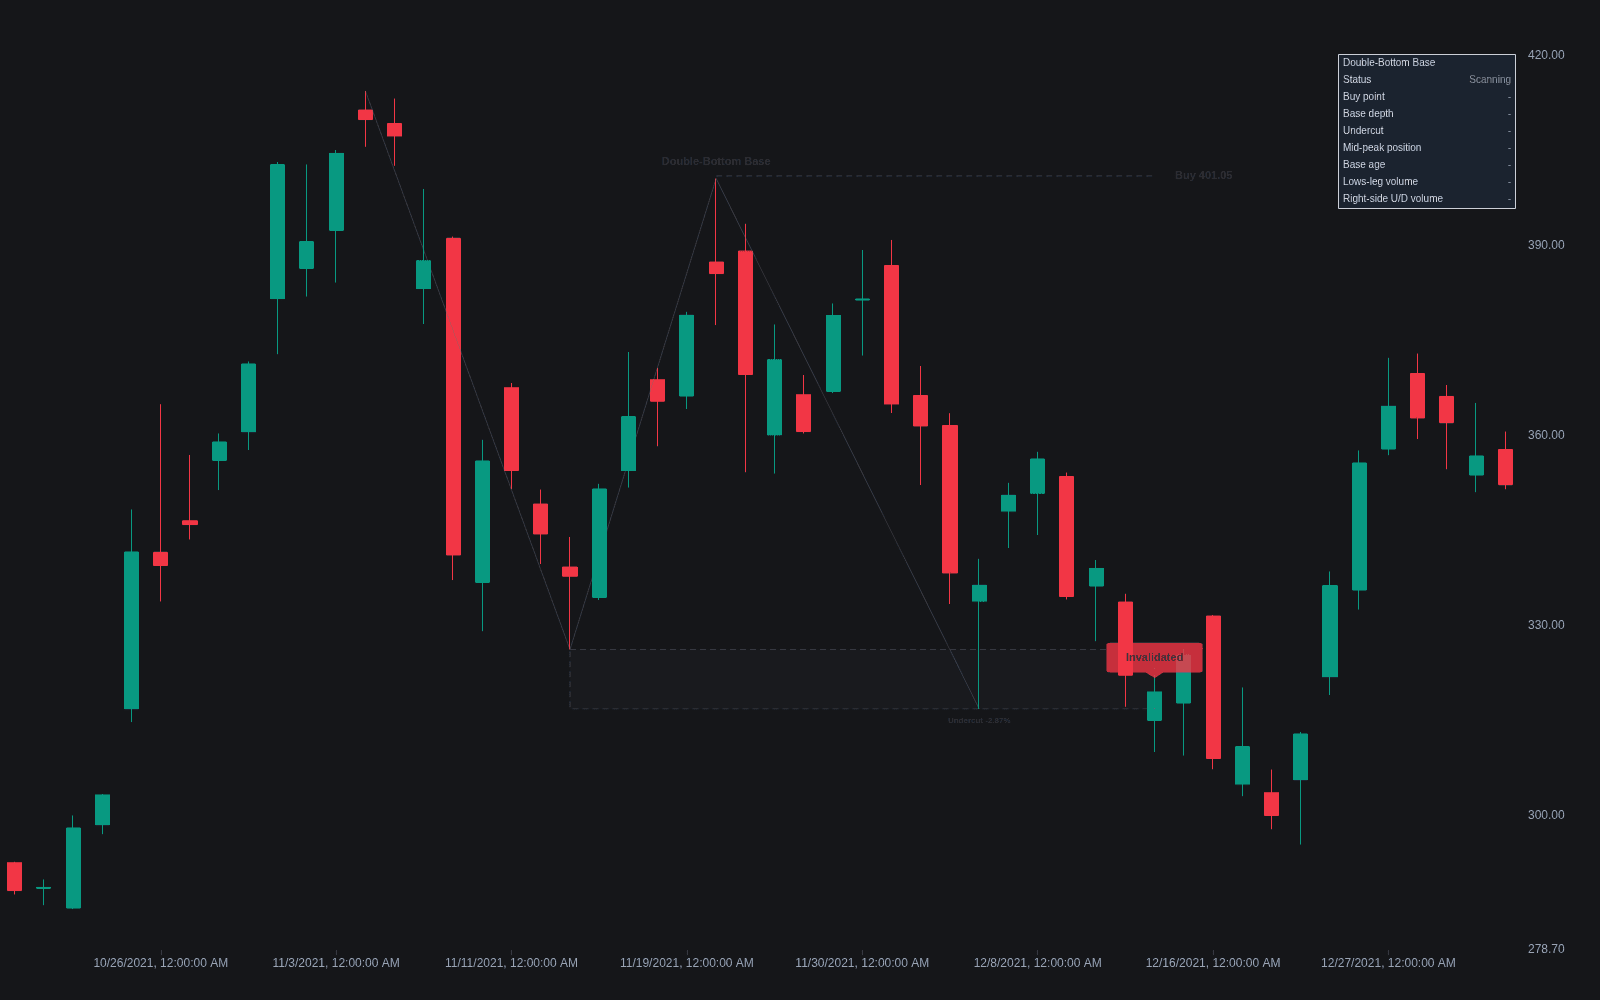
What is a Double-bottom Base?
The double-bottom base is the W-shaped member of William O'Neil's base taxonomy: a growth stock corrects, rallies, then sells off again to a second low that undercuts the first before recovering and breaking out. The defining twist, and the detail that separates it from the classical pattern, is that the second leg is supposed to dip below the first low. That undercut shakes out holders whose stops rest at the obvious prior low, clearing supply so the subsequent advance meets less resistance.
The IBD specification generally expects the base to run at least about seven weeks, with depth commonly in the range of other intermediate corrections rather than extreme. The buy point is not the old high but the peak in the middle of the W, plus a small margin, on the logic that clearing the midpoint proves demand has already absorbed the second decline. As with every pattern in O'Neil base analysis, a valid breakout through that pivot is expected on volume well above average.
Traders care because the pattern formalizes a familiar market trick: the second low that briefly breaks the first looks like failure, punishes the crowd positioned at the obvious level, and then reverses. The double-bottom base tends to appear in choppier, more volatile markets than the smoother cup, and IBD's historical studies of leading stocks treat it as one of the productive structures from which big advances launch, with the usual caveat that failure rates are material.
How to identify a double-bottom base on a chart
Look for the W on a weekly chart and insist on the undercut; without it you have a different pattern.
- 1Require a prior uptrend worth basing after, then trace two distinct sell-offs separated by an interim rally.
- 2Verify that the second low undercuts the first, even slightly; the shakeout is the functional heart of the pattern.
- 3Check proportions: the base generally spans at least about seven weeks, and the middle peak typically sits in the upper portion of the structure rather than barely off the lows.
- 4Watch volume character: heavy selling into the lows followed by quieter trade and supportive volume on the right-side recovery reads as accumulation.
- 5Set the pivot just above the middle peak of the W and require expanding volume on the move through it.
- 6Treat a third trip to the lows with suspicion; repeated tests degrade the shakeout logic and often evolve into a broader, weaker structure.
How traders use it
- Pivot entry: the standard play buys the push through the mid-peak pivot within a small buy zone, deliberately entering before the old high is regained because the undercut already removed much of the overhead pressure.
- Shakeout interpretation: the undercut low is read as forced selling rather than new information, so a fast reclaim of the first low is the early tell that the pattern is working.
- Risk control: losses are capped with the standard fixed percentage stop below the buy point, with the undercut low serving as the structural invalidation for the whole base.
- Handle variant: some double bottoms add a small handle after the right side forms, which shifts the buy point to the handle high and often tightens the entry.
- With limits: W shapes are common and most are not valid bases, weak general markets break even textbook versions, and the mid-peak entry means buying into some overhead supply, which is the price of the earlier pivot.
Double-bottom base vs. related patterns
Double Top/bottom: The classical double bottom prefers two lows at roughly equal levels and confirms at the interim high; the O'Neil base requires the second low to undercut the first and applies growth-stock length and volume rules.
Cup-with-handle Base: The cup rounds out one smooth low and adds a handle shakeout near the top; the double-bottom base does its shaking out at the lows via the undercut, and pivots off the middle of the W.
Flat Base: A flat base is a shallow sideways drift with no dramatic lows at all; the double-bottom base is a genuine two-legged correction resolved by a shakeout.
Concept family
Chart & Candlestick Patterns
84 concepts mapped · 84 in the Library
Double-bottom Base FAQ
Turn Double-bottom Base into a trading strategy.
Take the implementation from this page into Quant, then build on it, backtest it on real data, and keep refining it in conversation.