Three Rising Valleys/falling Peaks
Three Rising Valleys/falling Peaks, also known as three rising valleys, three falling peaks, 3RV, are Chart & Candlestick Patterns concepts. The Library holds 1 implementation, a working definition you can pull into Quant.
Top Three Rising Valleys/falling Peaks indicator
The top custom implementation, built on the original standard Three Rising Valleys/falling Peaks formula.
1 total
This Three Rising Valleys/falling Peaks implementation is strategy-ready: open it in Quant, set your rules, and it backtests automatically.
What are Three Rising Valleys and Three Falling Peaks?
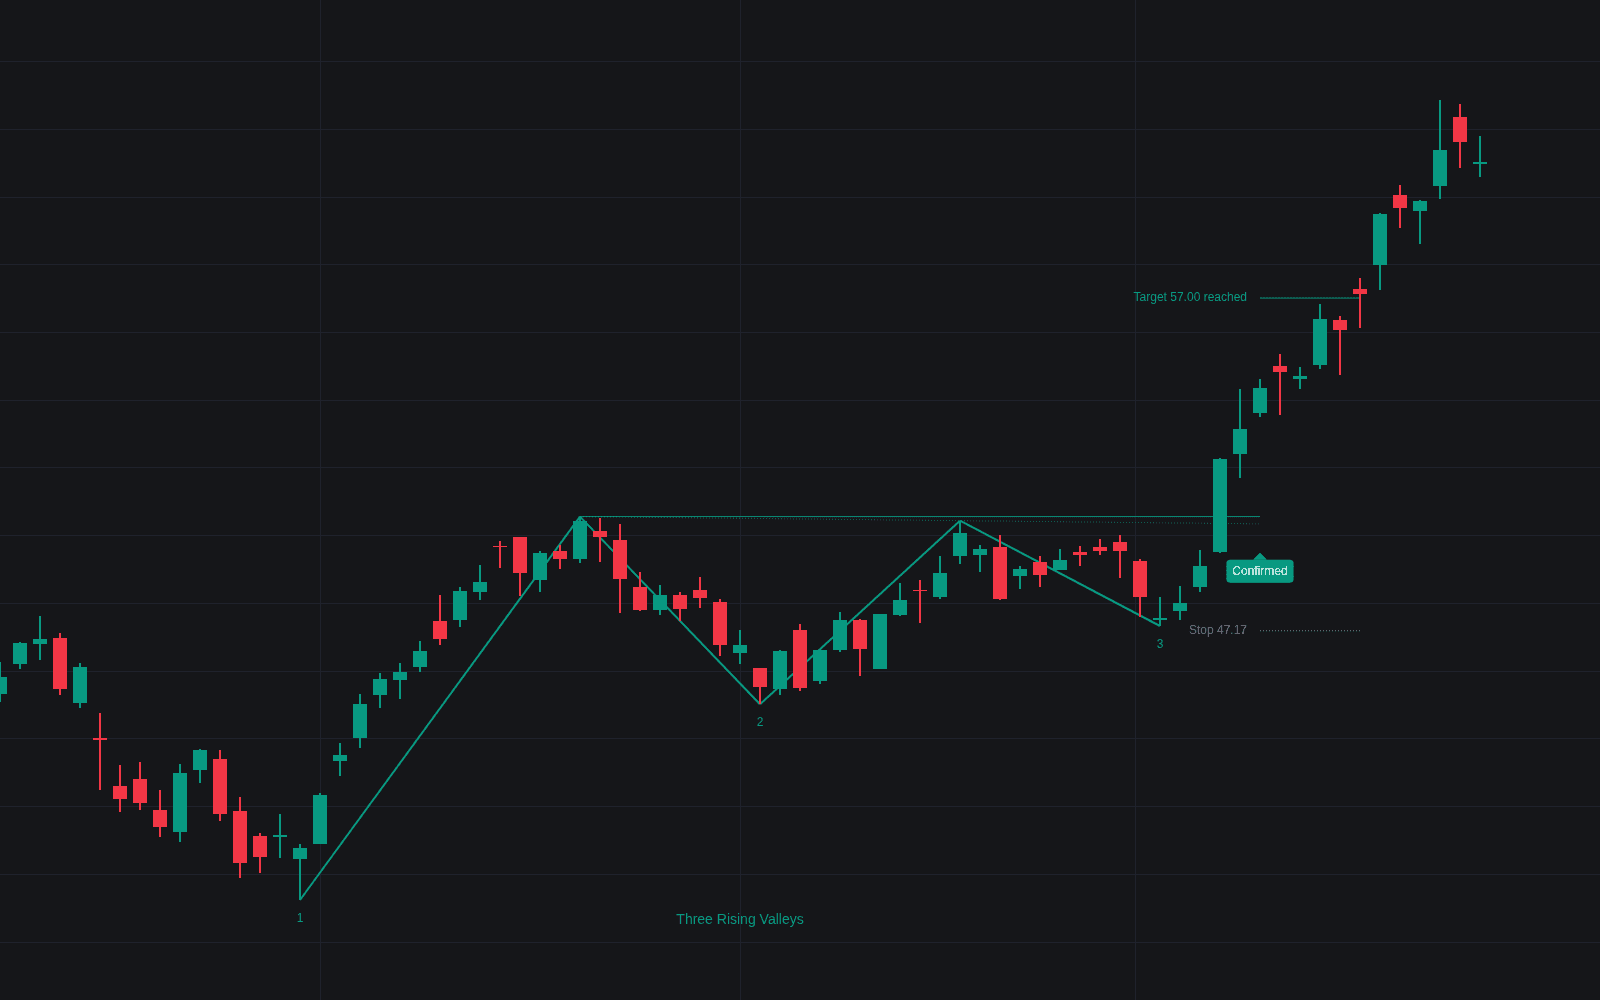
Three rising valleys and three falling peaks are a mirrored pair of chart patterns catalogued by Thomas Bulkowski in his Encyclopedia of Chart Patterns. Three rising valleys is three successive valleys, each bottom above the one before, confirmed when price closes above the highest peak in the pattern. Three falling peaks is three successive peaks, each lower than the one before, confirmed when price closes below the lowest valley in the pattern.
The read is structural. Rising valleys show buyers stepping in at higher prices on each dip; falling peaks show sellers arriving earlier on each rally, the higher-low and lower-high logic of swing structure. Bulkowski keeps the shape rules loose: the valleys or peaks should look alike (all narrow or all wide, not mixed), and falling peaks need not line up on a trendline. The confirming close is what makes it a pattern.
Bulkowski notes that price usually rises into both patterns, so three rising valleys can act as a continuation or a reversal (continuations performed better in his data), while three falling peaks after an advance records a weakening rally.
How to identify three rising valleys or three falling peaks
Find the swings first, then let the confirmation level decide.
- 1Find three swing lows, each above the last, or three swing highs, each below the last, similar in size and shape.
- 2Mark the confirmation level: the highest peak inside the three rising valleys, or the lowest valley inside the three falling peaks.
- 3Confirm only on a close beyond that level; until then the shape is just a sequence of swings.
- 4For a target, Bulkowski's variant of the measure rule takes the height from the highest peak to the lowest valley, scales it by the share of his historical samples that reached a full-height target, and projects the result from the confirmation level.
- 5Place stops beyond the latest swing: below the third valley for longs, above the third peak for shorts.
How traders use it
- Confirmation entries: trade the close beyond the confirmation level, giving up entry price for a completed pattern.
- Early entry: when the highest peak of a three rising valleys sits between the first two valleys, Bulkowski draws a down-sloping trendline across the two highest peaks and treats a close above it as an earlier buy signal.
- Short management: after three falling peaks, his rule of thumb is to cover if price climbs back above any of the peaks.
Rising valleys and falling peaks vs lookalikes
Triple Top/bottom: A triple top or bottom tests the same level three times. Here each swing steps away from the last, so the level is moving rather than holding.
Ascending/descending/symmetrical Triangle: An ascending triangle also has rising lows, but against a flat ceiling with touches on both boundaries. Three rising valleys sets no rule for the peaks beyond the confirmation close.
Concept family
Chart & Candlestick Patterns
88 concepts mapped · 88 in the Library
Three Rising Valleys/falling Peaks FAQ
Turn Three Rising Valleys/falling Peaks into a trading strategy.
Take the implementation from this page into Quant, then build on it, backtest it on real data, and keep refining it in conversation.