KAMA
KAMA, also known as Kaufman adaptive moving average, is a Trend concept. The Library holds 1 implementation, a working definition you can pull into Quant.
Kaufman adaptive. efficiency ratio
Top KAMA indicator
The top custom implementation, built on the original standard KAMA formula.
1 total
Want to trade KAMA? The implementation below is one prompt away from a backtested strategy in Quant.
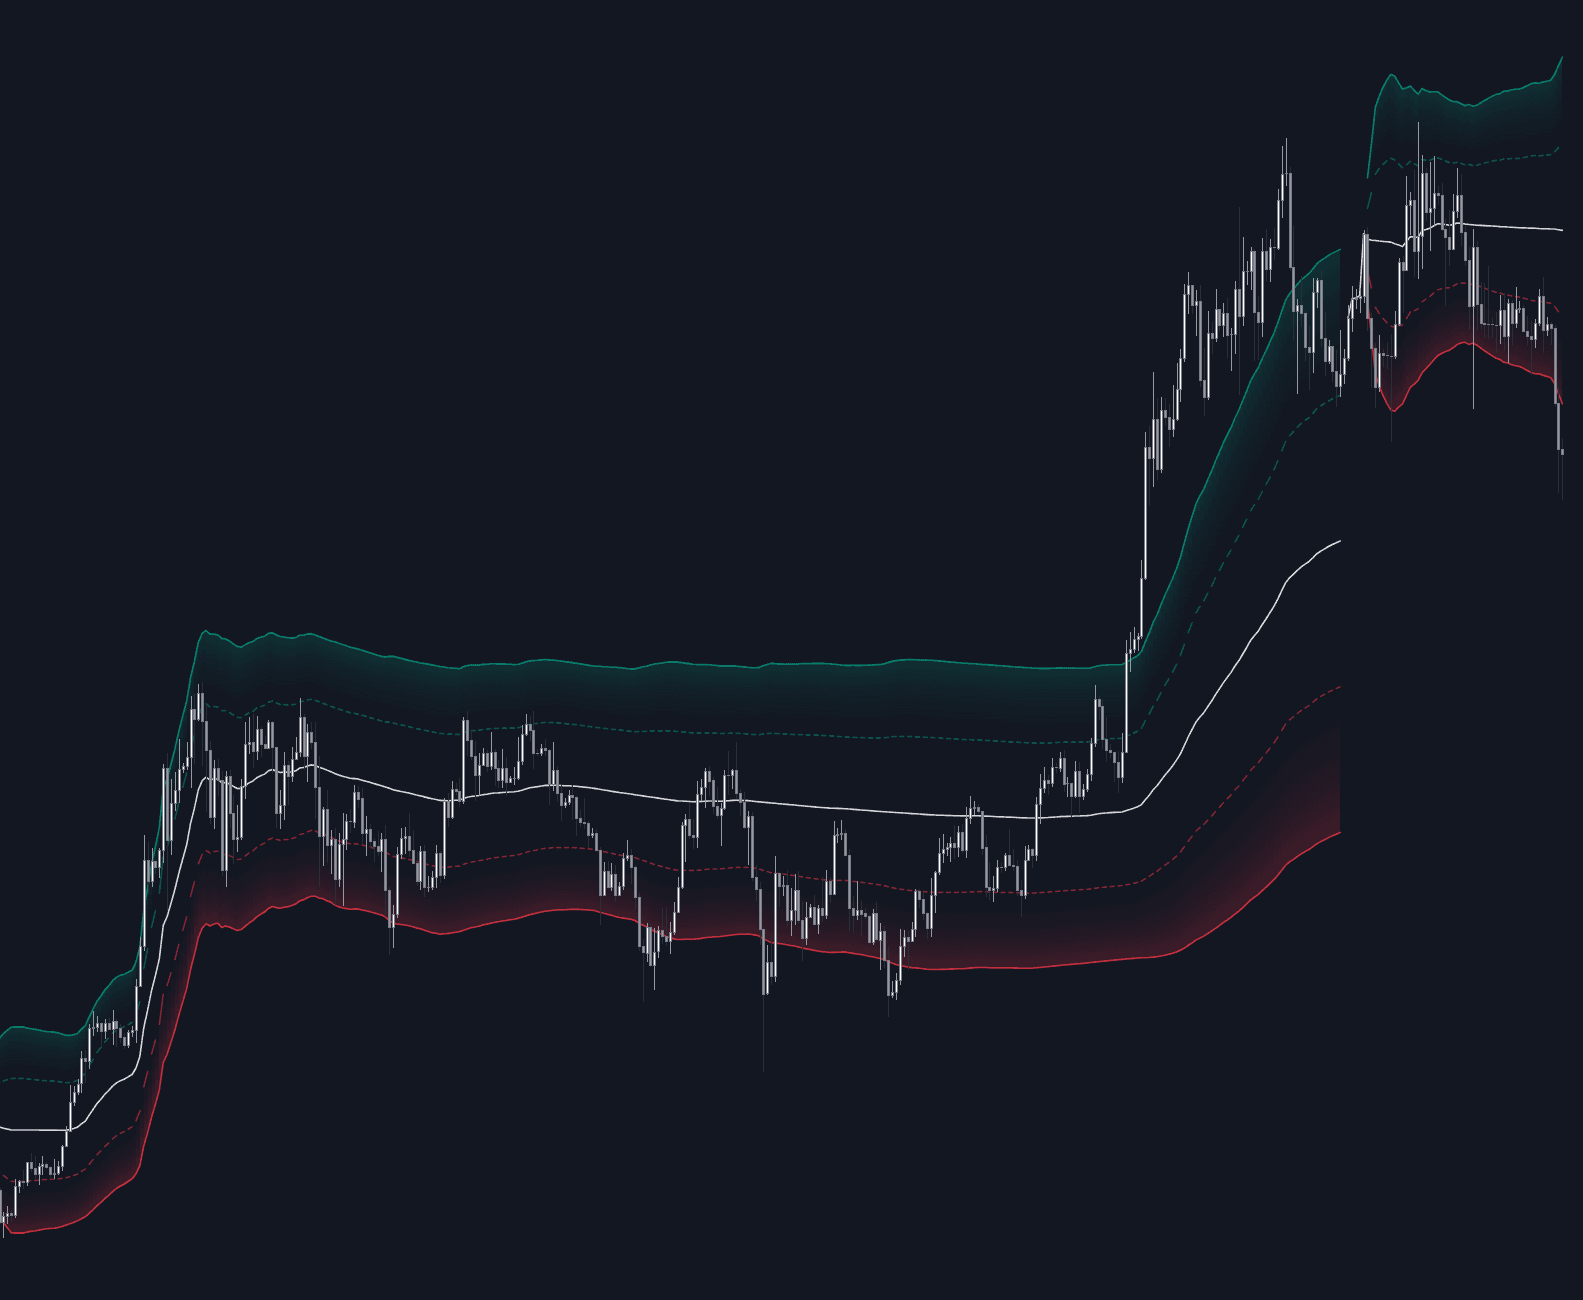
What is KAMA?
KAMA, Perry Kaufman's adaptive moving average, is an exponential average whose smoothing constant changes bar by bar with how efficiently price is moving. The sensor is the Kaufman Efficiency Ratio: net change over the lookback divided by the sum of absolute bar-to-bar changes. A straight-line move scores near 1; a path that backtracked all the way scores near 0. KAMA maps that score between a fast and a slow EMA constant (commonly 2-period and 30-period equivalents), squares it, and uses the result as the weight on new price.
Kaufman introduced the average in his 1995 book Smarter Trading; he came to markets from aerospace work and also wrote Trading Systems and Methods, a standard reference on mechanical trading. His motivation was practical: a fixed-length average is tuned to one kind of market, so it turns too slow in trends or too jumpy in congestion the moment conditions change. Rather than asking the trader to keep re-optimizing the length, KAMA reads the market's own noisiness and retunes itself every bar.
The squaring matters: middling efficiency gets pushed toward the slow end, so KAMA spends choppy periods nearly flat, ignoring noise, and only accelerates when direction is genuinely persistent. That makes flatness informative in its own right, a built-in no-trend flag. The cost is adaptation lag: the efficiency ratio is computed over a window, so KAMA needs several bars of clean movement before it believes a new trend, and fresh breakouts from quiet ranges are exactly where it starts slow.
KAMA was among the first widely adopted adaptive averages, and it helped establish the idea that a smoothing parameter can be driven by a measurement instead of fixed by hand, a design echoed across the adaptive family. The practical shift is where the risk lives: with an SMA or EMA the risk is choosing the wrong length; with KAMA the length matters less and the sensor's behavior matters more, including its blind spot of arriving late to sudden moves.
How to calculate KAMA
Kaufman's published recipe has three moving parts:
- 1Efficiency Ratio: ER = absolute net price change over the last N bars divided by the sum of absolute one-bar changes over the same window (N = 10 is the common default), giving a value between 0 and 1.
- 2Smoothing constant: SC = [ER × (fast − slow) + slow]², where fast and slow are the EMA constants 2/(2+1) and 2/(30+1) in the common parameterization.
- 3Recursion: KAMA today = KAMA yesterday + SC × (price − KAMA yesterday), the standard EMA update with the adaptive weight.
- 4Read the output together with its own slope: a sloping KAMA tracks the trend, a flat KAMA declares the window inefficient.
How it's calculated
KAMA is a moving average whose smoothing speed adapts to the efficiency ratio, tracking price closely in directional markets and flattening in choppy ones.
Kaufman's defaults are 10, 2, 30; because the blend is squared, SC_t runs between slowSC^2 and fastSC^2, damping the average most when ER_t is low.
When Volatility_t is 0 the ratio is undefined; implementations treat ER_t as 0, which applies the slowest smoothing on that bar.
How traders use it
- As a self-filtering trend line: price relative to KAMA plus the line's own slope, with the flat-line state acting as a stand-aside signal that fixed-length averages cannot provide; it doubles as a crude trend regime label.
- In crossover and trailing logic: Kaufman himself suggested acting only when the average turns by more than a small filter (a fraction of the standard deviation of its own recent changes) rather than on every wiggle.
- As a smoothing engine elsewhere: applying KAMA to an oscillator or another indicator's output quiets rangebound noise while keeping trend response, the same adaptivity transplanted.
- As a regime dial via its input: the efficiency ratio itself is worth plotting, and many traders treat low-efficiency stretches as no-trade zones regardless of what the average does.
- As dynamic support or resistance: in trends, pullbacks are watched against the rising or falling line, with the flat state warning that the average has stopped describing a trend at all.
KAMA vs other adaptive and smoothed averages
EMA: Fixed smoothing constant whatever the conditions. The comparison is the whole pitch for KAMA: an EMA treats a whipsaw range and a clean trend identically, KAMA does not.
Adaptive-lookback MA: Same goal, different lever. An adaptive-lookback average shortens or lengthens its window as conditions change, while KAMA keeps the window fixed and modulates the weight on new price. Both trade parameter tuning for sensor design.
Ehlers SuperSmoother: Not adaptive at all: a fixed filter from signal processing that removes short-cycle noise with modest lag on every bar. It represents the other answer to chop, filter better rather than adapt, and it will not flatline in ranges the way KAMA deliberately does.
Concept family
Trend
100 concepts mapped · 100 in the Library
KAMA FAQ
Turn KAMA into a trading strategy.
Take the implementation from this page into Quant, then build on it, backtest it on real data, and keep refining it in conversation.