Concept
Fan Principle
Fan Principle is a Trend concept. The Library holds 1 implementation, a working definition you can pull into Quant.
Top Fan Principle indicator
The top custom implementation, built on the original standard Fan Principle formula.
1 total
Want to trade Fan Principle? The implementation below is one prompt away from a backtested strategy in Quant.
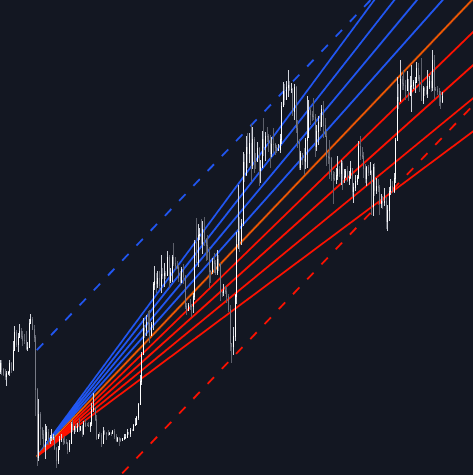
What is the Fan Principle?
The fan principle is a classical charting technique in which successive trendlines are drawn from the same anchor point as a trend decelerates. When the original steep trendline breaks, price makes a new pivot and a second, flatter line is drawn from the same origin; if that breaks, a third follows. The lines fan out from one point, and each break records a loss of slope rather than an immediate reversal.
The technique belongs to the classical trendline canon: it appears throughout twentieth-century charting literature and is preserved in the standard references, John Murphy's coverage of trendline analysis being the best-known modern statement of the three-line convention. Its persistence owes to what it encodes: a trend rarely reverses from full speed in one act, and the fan turns that deceleration into a countable sequence of drawn and broken lines.
The classical rule of thumb holds that a break of the third fan line signals the trend has reversed. Broken fan lines also tend to swap roles, with former support acting as resistance on retests. The principle differs from pre-drawn fans such as speed resistance lines or the Gann fan, which project fixed geometric angles in advance; fan-principle lines are ordinary trendlines redrawn from real pivots as the trend flattens.
Mechanically the fan is a slope diary. Each redraw connects the same origin to a later, lower-angle pivot structure, so the sequence of line slopes is a record of the trend's fading rate of progress, the drawn-geometry cousin of watching a moving average's slope flatten on an MA slope filter. The count matters less than the shape it documents: three breaks from one anchor describe a rounding turn, which is why the third break earned its classical status as the reversal cue.
How to apply the fan principle on a chart
The uptrend case is described; invert every step for downtrends.
- 1Anchor at the trend's origin: the significant swing low that started the advance.
- 2Draw the first trendline from that anchor under the initial rising pivots; steep early trends make this line break sooner rather than later.
- 3When price closes through the line and sets a new higher-timeframe pivot, draw the second, flatter line from the same anchor through the new structure.
- 4Repeat on the next break: the third line from the same origin completes the fan.
- 5Treat a decisive break of the third line as the classical reversal signal, and require confirmation, a structure break or a breakout of the opposing side, before trading it.
- 6Watch broken lines on retests: each one is a candidate role-reversal reference where rallies can stall.
How traders use it
- As a trend-maturity gauge: each broken and redrawn line documents deceleration, warning that the trend is losing thrust, often before a reversal pattern completes.
- As a reversal trigger: the third-line break is the classical signal, usually taken with confirmation such as a structural break or volume, since fan counts alone misfire.
- As a retest map: broken fan lines become candidate resistance (or support) where pullbacks can stall.
- As a cross-check on regime tools: a completed three-line fan agrees or argues with formula-based reads such as a trend regime label or a flattening MA slope filter, and disagreement is itself information about how clean the turn is.
- As a patience structure: because each line demands a real break and a real new pivot, the fan forces a staged reassessment instead of calling a reversal on the first trendline violation.
Fan Principle vs other slope tools
Trendline: A single trendline is one hypothesis about the trend's slope; its break is a one-shot event. The fan principle strings three such hypotheses from one anchor, converting isolated breaks into a documented deceleration sequence.
MA Slope Filter: A slope filter measures deceleration continuously from an average's gradient, updating every bar without judgment calls. The fan records the same fading thrust in discrete, drawn steps anchored to real pivots, legible on the chart but dependent on pivot selection.
Trend Regime Label: A regime label outputs a state (trending or not) from formulas. The fan supplies the geometric evidence behind such a state change: three progressively flatter lines failing is what a trend-to-range transition looks like drawn by hand.
Concept family
Trend
100 concepts mapped · 100 in the Library
Fan Principle FAQ
Turn Fan Principle into a trading strategy.
Take the implementation from this page into Quant, then build on it, backtest it on real data, and keep refining it in conversation.