Concept
Volume-adjusted MA
Volume-adjusted MA is a Trend concept. The Library holds 1 implementation, a working definition you can pull into Quant.
Top Volume-adjusted MA indicator
The top custom implementation, built on the original standard Volume-adjusted MA formula.
1 total
The Volume-adjusted MA implementation below can become a backtested trading strategy — describe your rules and Quant writes the code.
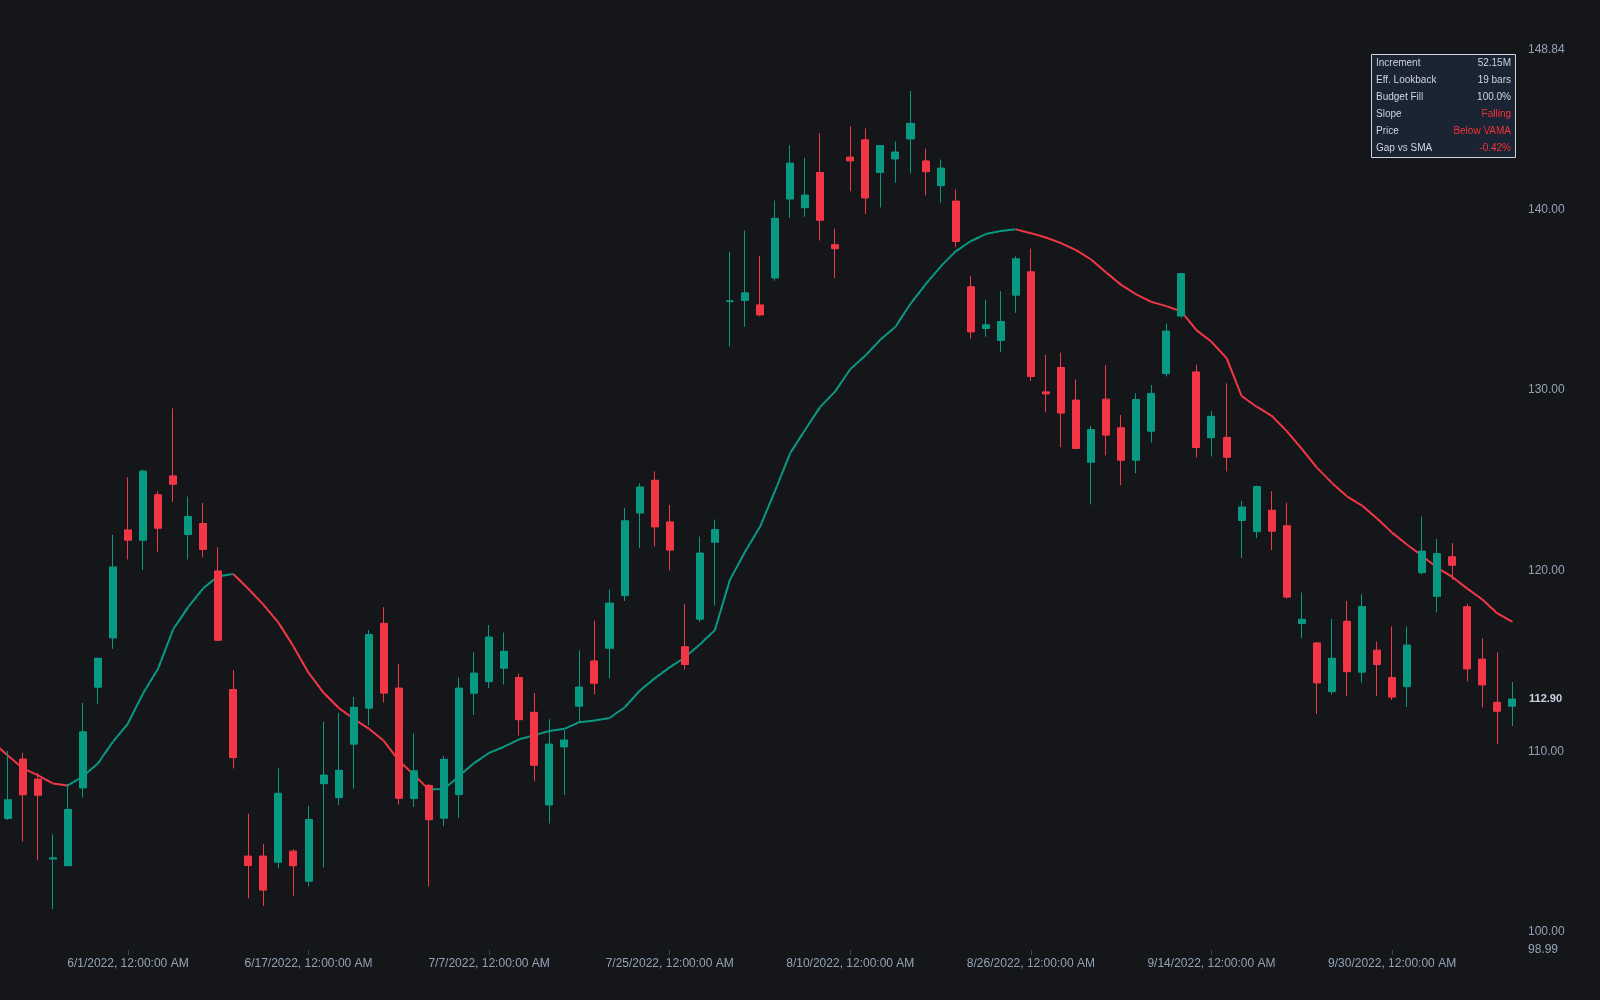
What is a Volume-adjusted MA?
A volume-adjusted moving average weights each bar's price by how much trading it carried, so heavily traded bars pull the average toward their price and quiet bars barely register. The idea is usually credited to Richard Arms, the EquiVolume developer: his construction allocates weight in fixed volume increments and reaches back over however many bars are needed to accumulate them, so the effective lookback stretches in thin trade and compresses when activity surges.
Arms spent a career arguing that markets should be measured in activity rather than clock time, the thesis behind EquiVolume charting and the Arms Index, and the volume-adjusted average is that thesis applied to smoothing: instead of asking what the last N bars averaged, it asks what the last N units of business averaged. His 1990s volume work laid out the increment-based construction; platform implementations have since multiplied around the same premise.
The label is looser than most moving-average names. Many modern implementations keep a fixed window and weight each bar by its volume relative to average volume, which lands close to a VWMA; others reproduce Arms' elastic-lookback version. The shared premise is that prices where heavy volume changed hands say more about accepted value than prices printed on thin activity, so volume rather than time alone should set each bar's influence.
Behavior follows the weighting. In a volume surge the line converges fast on the surge's prices, effectively shortening itself exactly when new information arrives; in drift it goes stubborn, anchored to the last heavily traded prices, which is what makes thin rallies visibly fail to drag it along. The costs are inherited from the volume feed: venue-dependent readings in crypto, tick-count proxies in spot FX, and a single distorted print bending the line more than any time-weighted average would allow.
How to read a volume-adjusted MA
Implementations differ enough that reading one starts with knowing which formula is on the chart.
- 1Identify the construction: Arms-style elastic lookback, or a fixed window with volume weights (VWMA-like); the two behave differently in quiet stretches.
- 2Overlay a same-length SMA once: the gap between the lines is volume's opinion, visible wherever heavy bars pulled the adjusted line away.
- 3Read it as a trend baseline: side and slope carry the usual meaning, with the line's convergence speed now tied to activity.
- 4Watch surge behavior: a burst of heavy bars snaps the line toward the new prices, the volume-weighted version of a lookback shortening itself.
- 5Watch drift behavior: price walking away from a flat line on thin volume is the tool's signature warning that the move lacks participation.
- 6Audit the volume feed: on venue-fragmented or tick-proxy data, the same formula draws materially different lines.
How it's calculated
Richard Arms' moving average weights each bar by its relative volume, so heavy-volume bars pull the average harder and the bar span adapts to activity.
Defined by Richard Arms; the number of bars spanned expands in quiet markets and shrinks in active ones.
Distinct from the volume-weighted MA, VWMA = (Σ C_i × V_i) / (Σ V_i) over a fixed number of bars, which some platforms label similarly.
Because AvgV covers the whole reference period, new data can slightly change past values unless the average is anchored.
How traders use it
- As a participation-weighted trend baseline: price holding above a rising volume-adjusted MA suggests the heavily traded prices are stacking up beneath the market, and crosses are read like any MA cross, with heavy-volume bars moving the line fastest.
- As a filter on thin drift: quiet bars barely move the line, so an extended move on weak relative volume that fails to drag the average with it is treated with suspicion.
- As a drop-in replacement for time-weighted averages in crossover or band logic when the builder wants responsiveness tied to activity instead of a fixed period.
- Against its time-weighted twin: running the volume-adjusted line in a crossover against the same-length SMA isolates volume's contribution, with the pair separating exactly when heavy trade disagrees with the calendar.
- In stacked form: several volume-adjusted lengths built into a ribbon read like any MA stack, with the added property that the whole fan re-anchors quickly after high-volume episodes.
Volume-adjusted MA vs neighboring averages
VWMA: The VWMA is a single fixed formula: the last N closes weighted by raw volume over a set window. Volume-adjusted MA is a broader label whose Arms-lineage versions let the lookback itself flex with accumulated volume, so always check which formula a given tool implements.
Elastic Volume-weighted MA: The eVWMA is recursive: each bar's volume, divided by a volume budget, becomes that bar's smoothing weight in an EMA-style update. No window is involved, whereas volume-adjusted MAs are typically window-based, whether the window is fixed or volume-elastic.
SMA: The SMA is the pure time-weight benchmark: every bar counts once, however dead or frantic its trade. The volume-adjusted version re-ranks the same prices by participation, and the distance between the two lines is precisely the information the re-ranking added.
Concept family
Trend
100 concepts mapped · 100 in the Library
Volume-adjusted MA FAQ
Turn Volume-adjusted MA into a trading strategy.
Take the implementation from this page into Quant, then build on it, backtest it on real data, and keep refining it in conversation.