Concept
Aroon
Aroon, also known as Aroon up/down, Aroon oscillator, is a Trend concept. The Library holds 1 implementation, a working definition you can pull into Quant.
The standard Aroon indicator
Aroon exactly as classically defined: the faithful reference build of the original formula, free to run in Quant.
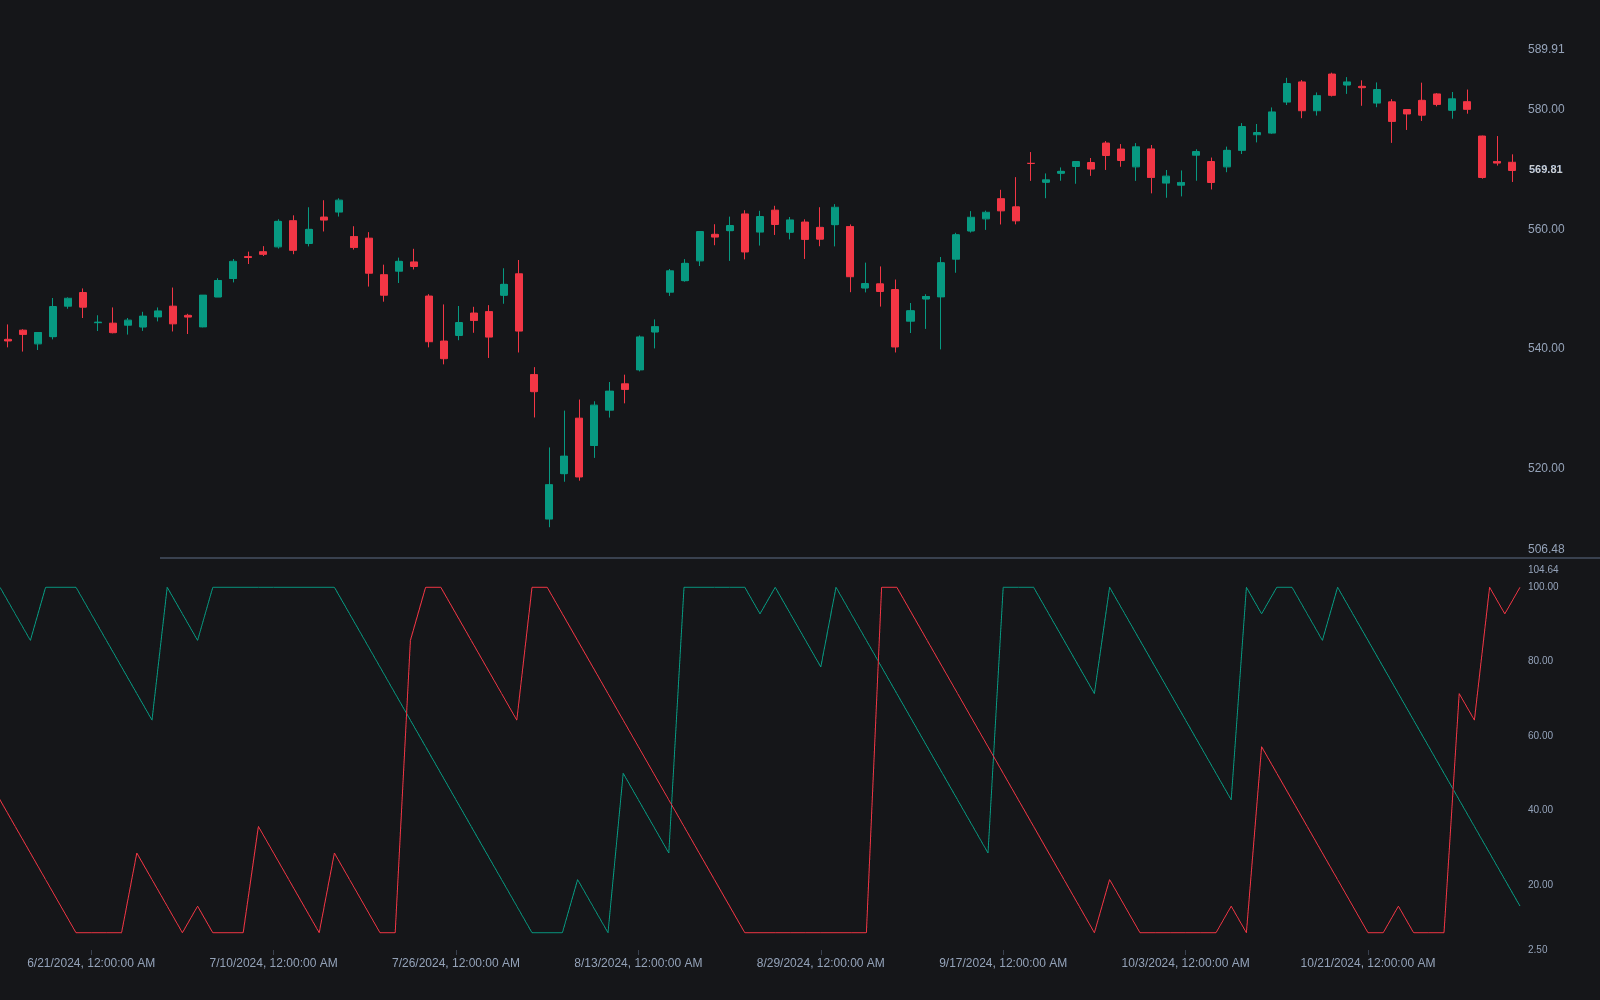
What is Aroon?
Aroon is a pair of lines Tushar Chande introduced in 1995 that measure time instead of magnitude. Aroon Up counts the bars since the highest high of the lookback window (25 periods is the common default) and rescales the count to 0-100, so a high printed this bar reads 100 and a high a full window old reads 0. Aroon Down does the same with the lowest low. The name comes from a Sanskrit word for the light of dawn, reflecting the goal of catching a trend near its start.
The arithmetic is worth seeing once: Aroon Up equals (n minus bars since the n-period high) divided by n, times 100. Nothing about the size of moves enters the formula, only their recency. That is the tool's entire personality: it asks when the last record was set, not how big it was, so a grinding trend of marginal new highs and a violent breakout can produce the same pinned reading.
In an uptrend new highs keep arriving, so Aroon Up pins near 100 while Aroon Down decays; downtrends mirror this. Many platforms also plot the Aroon oscillator, Aroon Up minus Aroon Down, which swings between +100 and -100. Because the input is recency of extremes rather than size of moves, Aroon can flag a persistent grind that momentum tools understate, and both lines sagging together flags a trading range.
The blind spots follow from the same design. Aroon says nothing about slope or force, so it pairs naturally with tools that do, and every reading is hostage to the window: a strong high rolling out of the lookback can swing the lines without any new price action. In choppy conditions the two lines cross back and forth freely, which is why the crossover alone is usually treated as a prompt for further checks, such as a trend regime label or an MA slope filter, rather than an order trigger.
How to read Aroon on a chart
Aroon plots as two 0-100 lines (or one +100 to -100 oscillator) in its own pane, and each state maps to a simple statement about recent extremes.
- 1Add Aroon with the default 25-period window (14 is the common shorter choice) beneath the price chart.
- 2Check which line is on top: Up above Down says the latest record high is fresher than the latest record low, the basic directional state.
- 3Look for pinning: a line holding near 100 means new extremes keep printing in that direction, the signature of an active trend.
- 4Read both lines together: both below about 50 means neither a fresh high nor a fresh low has printed in half the window, the consolidation state.
- 5If you use the oscillator form, treat zero crosses as the crossover event and distance from zero as dominance, then confirm with a magnitude-based tool before acting.
How it's calculated
Measures how recently price set its n-bar high and low, scaled 0 to 100.
A reading of 100 means the extreme printed on the current bar; 0 means it printed n bars ago.
Some implementations scan n + 1 bars including the current one, which shifts values slightly.
Default length varies by platform, most often 14 or 25.
How traders use it
- As a trend-onset signal: Aroon Up crossing above Aroon Down (or the oscillator crossing zero) says highs are now fresher than lows, often used as breakout confirmation.
- As a strength read: Aroon Up holding above about 70 with Aroon Down below about 30 is the conventional description of an established uptrend, mirrored for downtrends.
- As a consolidation filter: both lines below 50 means neither a new high nor a new low has printed in half the window, a cue to shelve trend entries.
- As an exit tell: a line decaying from 100 while price drifts sideways says records have stopped printing, an early hint that the trend is stalling even before any reversal structure forms.
- As one input in a regime stack: Aroon's time-based state combines well with slope- and magnitude-based checks such as an MA slope filter or a Supertrend state, since the tools fail in different conditions.
Aroon vs other trend gauges
Moving Average Crossovers: A crossover compares two smoothed price consensuses, so it needs the averages to converge and cross, which takes time. Aroon flips as soon as extremes stop refreshing, so it often reads a stall earlier but whipsaws more in chop.
Supertrend: Supertrend is a volatility-banded trailing state that flips on price crossing an ATR offset, built for following. Aroon is a diagnostic that grades trend freshness on a 0-100 scale rather than issuing a single flip state.
MA Slope Filter: A slope filter measures the direction and steepness of an average, a magnitude read. Aroon measures the recency of records, a time read; a market can grind to marginal highs and pin Aroon at 100 while every slope stays shallow.
Concept family
Trend
100 concepts mapped · 100 in the Library
Aroon FAQ
Turn Aroon into a trading strategy.
Take the implementation from this page into Quant, then build on it, backtest it on real data, and keep refining it in conversation.