Concept
Displaced MA
Displaced MA is a Trend concept. The Library holds 1 implementation, a working definition you can pull into Quant.
DMA
Top Displaced MA indicator
The top custom implementation, built on the original standard Displaced MA formula.
1 total
Want to trade Displaced MA? The implementation below is one prompt away from a backtested strategy in Quant.
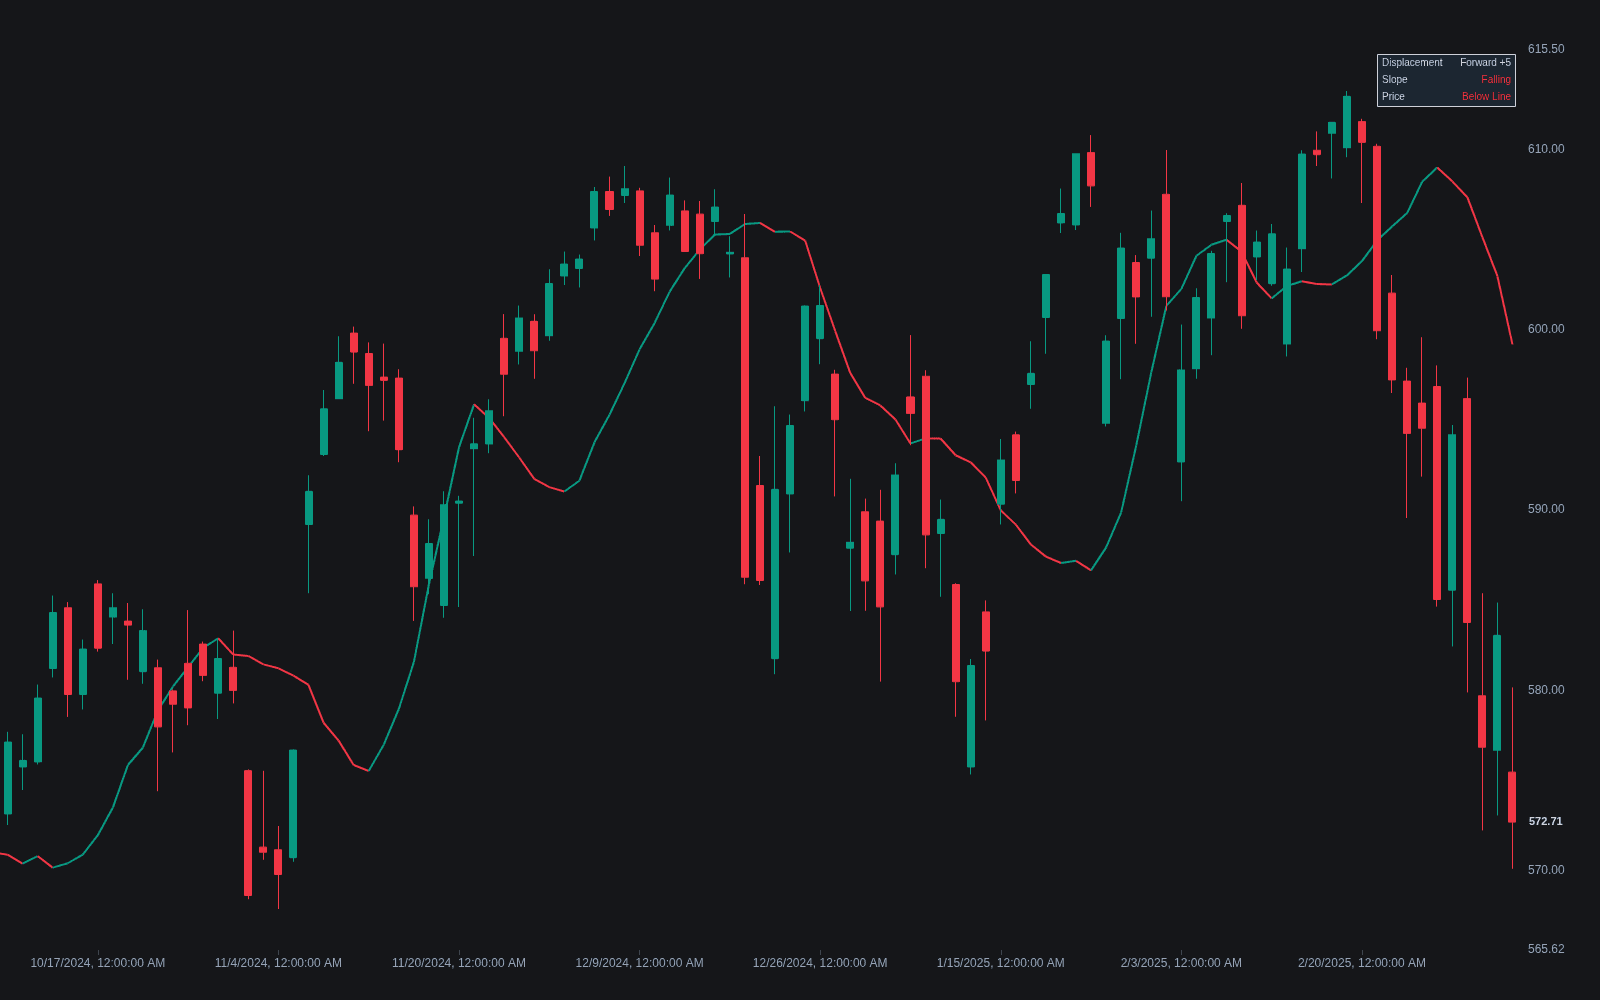
What is a Displaced MA?
A displaced moving average is an ordinary moving average shifted horizontally by a fixed number of bars. The calculation is untouched; only the plot moves. Positive displacement pushes the line rightward, so today's price is compared against an average computed several bars ago; negative displacement centers the line over the data it summarizes. Joe DiNapoli popularized forward-displaced simple averages (his 3x3, 7x5 and 25x5 lines) as trend and pullback references, a form of dynamic S/R.
Displacement is one of charting's older tricks. Centered averages have always been standard in time-series work, where an average belongs over the middle of its window, and traders have slid plots forward for decades to steady their signals; DiNapoli's books from the 1990s gave the forward version its best-known trading form, and the Ichimoku system, designed in mid-century Japan, builds both forward and backward displacement into its architecture natively.
Displacement changes timing, not information. Pushing the line forward delays crossovers, trading whipsaws for lateness, and plotting a series backward is the same trick in reverse: the Ichimoku lagging span displaces price itself 26 bars back. What displacement cannot do is reduce lag. The value under today's bar was computed from older data, and centered lines near the right edge cannot be known in real time.
The honest framing matters because a forward-displaced line invites an illusion: it extends under bars that had not printed when its values were computed, which can look like a forecast. It is not one. The line is a deliberately stale reference, useful exactly because it does not bend to the newest bars, holding still while price pulls back to it in a trend. Whether that staleness helps or hurts is strategy-specific, which keeps displacement a tool you test rather than a free improvement.
How to read a displaced MA on a chart
Displacement is a plotting offset, so reading one is about knowing where the information actually comes from.
- 1Plot the average with its displacement setting (a 7-period SMA shifted 5 bars forward is DiNapoli's 7x5) and confirm which direction your platform shifts for positive values.
- 2Compare it against the undisplaced version once: the shapes are identical, only slid along the time axis, which makes the timing change obvious.
- 3In trends, read pullbacks into the forward-displaced line as the reference test, the same way any dynamic S/R via MA read works.
- 4Treat closes through the line as early warnings that the leg is maturing rather than reversal proof, and require structure to agree.
- 5For negative (backward) displacement, remember the right-edge rule: the centered line has no final value for the most recent half-window, so it is a research view, not a live signal.
How it's calculated
A standard moving average whose plot is shifted forward or backward on the time axis by a fixed number of bars.
Displacement moves only where the line is drawn, not its values; with d > 0 the last d bars of the average extend beyond the latest price.
A negative d shifts the average onto earlier bars, which leaks future data into the past if used in backtests.
The 3-period SMA displaced 3 bars forward, popularized by Joe DiNapoli, is a well-known preset.
How traders use it
- As DiNapoli-style dynamic support and resistance: in a trending market, pullbacks toward a forward-displaced average are watched as continuation entries, and a close through it is an early warning that the leg is maturing, not proof of reversal.
- To damp whipsaws in crossover logic: displacing the slower line forward makes price and MA crossovers fire later and less often; whether the lateness costs more than the skipped whipsaws save is an empirical question per market.
- For centered smoothing in research: back-displacing aligns the average with the prices it summarizes, useful for offline cycle and detrending work, with the caveat that the most recent half-window has no final value yet.
- As a channel: plotting a displaced average of highs and one of lows forms a displaced MA channel, an envelope-style band whose edges price must overcome with conviction rather than merely touch.
- As a stable regime baseline: because the forward-displaced line ignores the newest bars, some traders use price's side of it as a slow trend regime label that flips less often than one built on a live average.
Displaced MA vs look-alikes
DEMA: The shared initials invite confusion, but DEMA is a different formula: a double-EMA combination designed to reduce lag inside the calculation. A displaced MA is any ordinary average with its plot slid sideways; the underlying values never change.
ZLEMA: Zero-lag averages modify the input, adding a momentum correction term to offset lag in the math. Displacement leaves the math alone and just moves the drawing, so it cannot make an average track price sooner.
Anchored MA: An anchored MA changes the window itself, expanding from a fixed starting event. A displaced MA keeps its rolling window and merely repositions where the result is drawn on the time axis.
Concept family
Trend
100 concepts mapped · 100 in the Library
Displaced MA FAQ
Turn Displaced MA into a trading strategy.
Take the implementation from this page into Quant, then build on it, backtest it on real data, and keep refining it in conversation.