Concept
Gann Box
Gann Box is a Trend concept. The Library holds 1 implementation, a working definition you can pull into Quant.
Top Gann Box indicator
The top custom implementation, built on the original standard Gann Box formula.
1 total
The Gann Box implementation below can become a backtested trading strategy — describe your rules and Quant writes the code.
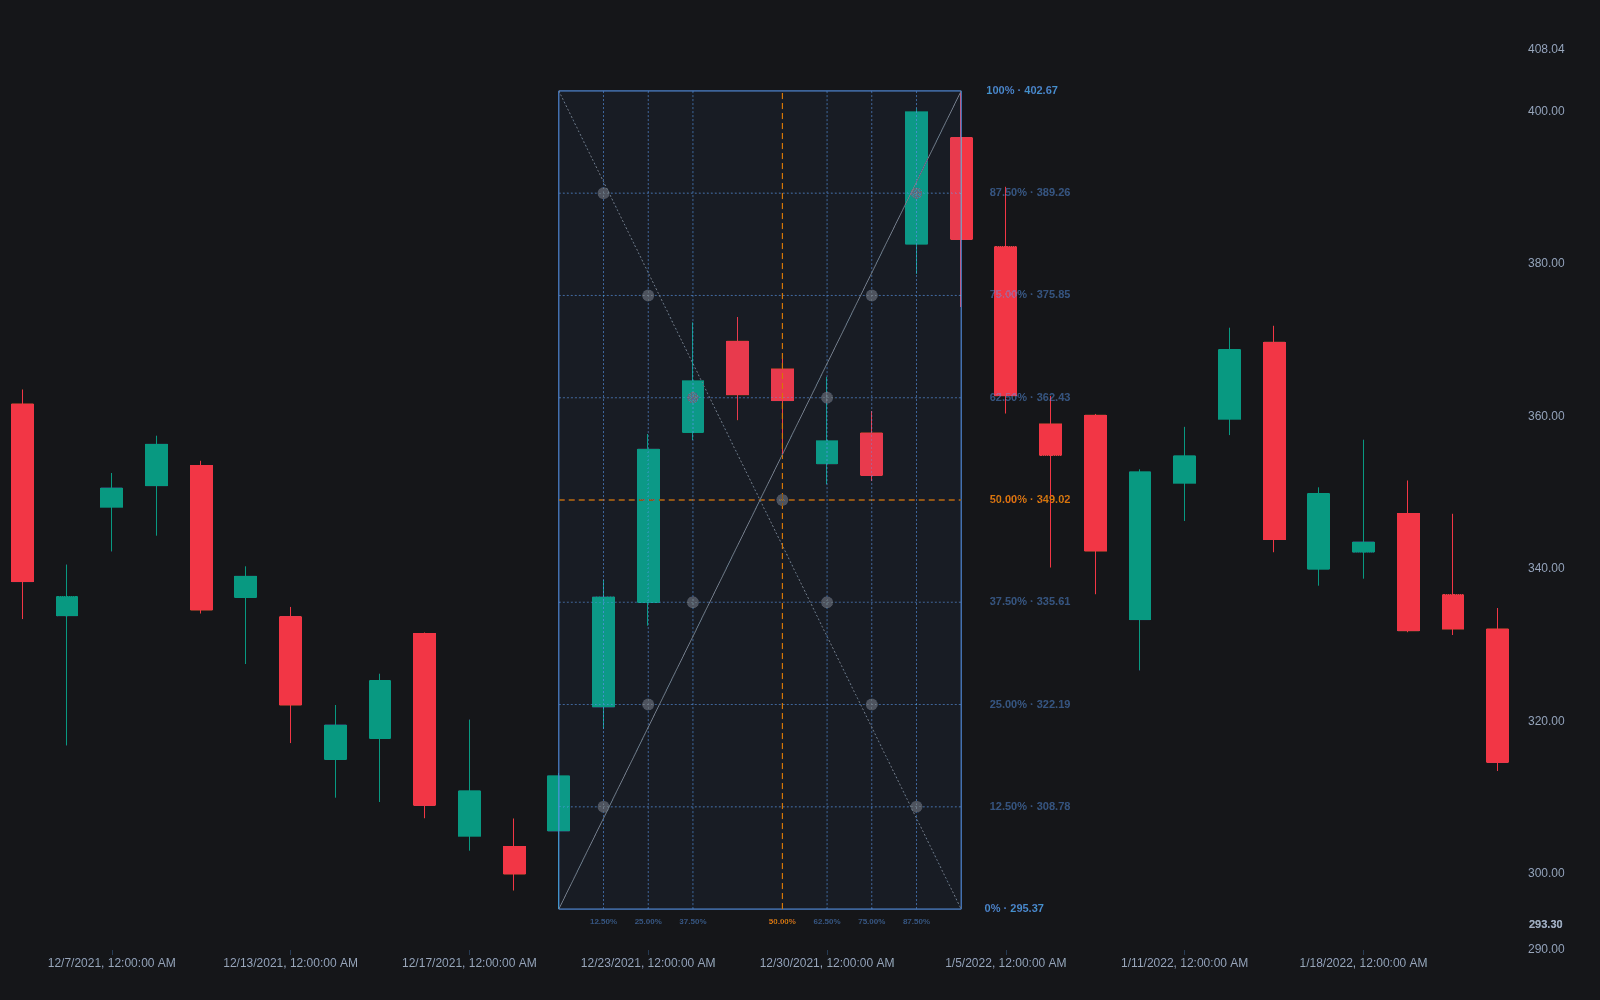
What is a Gann Box?
A Gann Box is a rectangular chart overlay anchored between two significant points, usually a major swing low and swing high, that subdivides the move in both price and time. The vertical side is split into fixed fractions (halves, quarters, and eighths are traditional; many versions offer Fibonacci ratios instead), the horizontal side divides the elapsed time the same way, and diagonals connect the corners. The tool descends from W.D. Gann's premise that price and time are proportional, so meaningful turns tend to occur where the two 'square': at intersections of the price divisions, the time divisions, and the diagonals.
William Delbert Gann (1878-1955) was an American commodities and stock trader who sold courses and books from the 1920s through the 1950s describing geometric methods: squaring price with time, angle lines, and calculators such as the Square of Nine. His writing is famously opaque, and independent verification of his results is thin, so the modern Gann Box is best understood as a charting-platform formalization of his squaring ideas rather than a tool he demonstrably drew in this exact form.
Mechanically, the box converts one anchor swing into a grid of references. The horizontal divisions are fractions of the move's height, the verticals are fractions of its duration, and the corner diagonals are constant-rate paths, in effect pre-drawn trendlines sloped by the box's proportions rather than by fitted pivots. Chart scale matters: switching between linear and log scale redraws the diagonals, so a box is only reproducible if the scale is held constant.
In practice, the internal horizontal lines serve as candidate support and resistance within the boxed range, the vertical lines as timing windows worth watching, and diagonal intersections as points of heightened interest. None of this is mechanical: the box only re-expresses the anchor swing as a grid, so anchor selection drives everything, and two traders can draw materially different boxes on the same chart. Reactions at box levels are possibilities to plan around, not predictions; a reversal that begins at one is confirmed by price behavior, not by the grid.
How to draw a Gann Box
The construction is simple; the judgment is in the anchors and in consistent settings.
- 1Pick the anchor swing: a swing low to swing high (or high to low) that defines a move significant on your trading timeframe.
- 2Set the box corners on those two extremes, using wicks or closes consistently, so the box spans the move's full price range and elapsed time.
- 3Enable the divisions you intend to use: halves, quarters, and eighths are traditional on both axes; many tools offer 0.382/0.5/0.618-style ratios instead.
- 4Hold the chart scale constant: moving between linear and log scale relocates the diagonals, so pick one convention and keep it.
- 5Mark the intersections near current price: horizontal divisions as levels, verticals as timing windows, and diagonal crossings as the higher-interest spots to watch.
How it's calculated
A price-time grid stretched between two anchor pivots, subdivided at fixed ratios of the box's price and time ranges.
There is no single canonical ratio set: Gann's squares used eighths (steps of 0.125), while modern platforms default to quarters plus 0.382 and 0.618.
Every level is a geometric consequence of the two anchors, so anchor selection determines the entire grid.
Some implementations square price and time, scaling so ΔP maps onto ΔT and the main diagonal runs at 45 degrees.
How traders use it
- As retracement-style levels: watching for reactions at the internal price divisions of the boxed swing, with the midpoint drawing the most attention, similar in spirit to a Fibonacci retracement.
- As a timing framework: the time divisions mark windows where Gann-oriented traders look for turns, comparable in intent to Fibonacci time tools.
- As confluence: an intersection of box geometry with an independently derived level, such as a prior high, a flat long-period SMA, or a Supertrend flip level, is treated as higher-interest than either alone.
- As breakout context: once price leaves the box entirely, the exited edge becomes the reference for breakout and retest tactics; some practitioners project a fresh box forward from the exit.
- As a standardizing grid in review: the box freezes one swing's proportions, letting traders measure pullback depth and elapsed time the same way across many trades.
Gann Box vs other level frameworks
Trendline: A trendline is fitted to actual pivots and updates as new swings form, so it encodes observed behavior. Gann Box diagonals are fixed the moment the box is anchored, encoding an assumed price-time proportion instead. Fitted lines adapt to the market; box geometry commits in advance.
Dynamic S/R Via MA: Moving-average support and resistance recalculates every bar, answering 'where is the trend now'. Box levels are static once drawn, derived from one historical swing, answering 'how does price relate to that reference move'. One adapts continuously; the other frames a fixed episode.
MA Envelope: An envelope wraps bands a set percentage around a moving average, framing price continuously as it evolves. A Gann Box frames one bounded episode with a defined start and end in price and time. Envelopes suit ongoing mean-reversion reads; boxes suit measuring one completed swing.
Concept family
Trend
100 concepts mapped · 100 in the Library
Gann Box FAQ
Turn Gann Box into a trading strategy.
Take the implementation from this page into Quant, then build on it, backtest it on real data, and keep refining it in conversation.