Concept
Harmonic MA
Harmonic MA is a Trend concept. The Library holds 1 implementation, a working definition you can pull into Quant.
Top Harmonic MA indicator
The top custom implementation, built on the original standard Harmonic MA formula.
1 total
The Harmonic MA implementation below can become a backtested trading strategy — describe your rules and Quant writes the code.
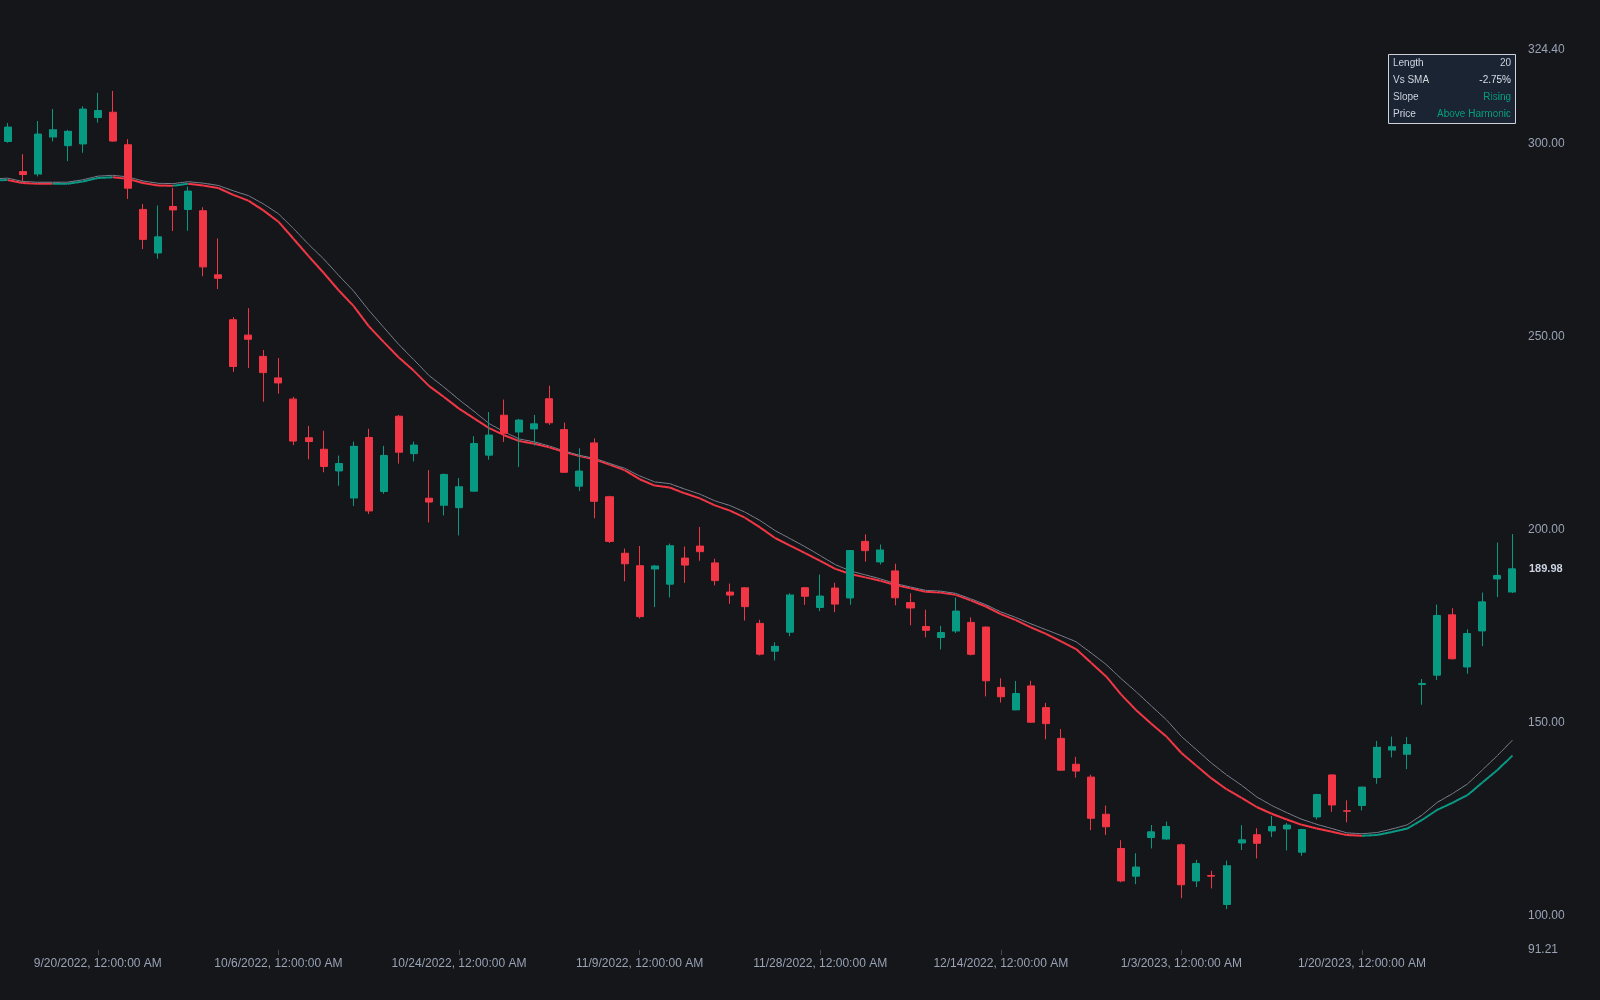
What is a Harmonic MA?
A harmonic MA smooths price with the harmonic mean instead of the arithmetic mean: over an n-bar window it equals n divided by the sum of the reciprocals of the prices. It is one of the three Pythagorean means, and for any positive series it sits at or below the geometric MA, which in turn sits at or below the SMA; the three coincide only when every price in the window is identical.
Averaging reciprocals makes the harmonic mean disproportionately sensitive to the smallest values in the window: dips pull it down harder than spikes pull it up, and it is only defined for strictly positive data, since a value near zero would dominate it entirely. On ordinary price series, where values inside a window differ by small percentages, it plots almost on top of the SMA; differences become visible only when the window spans large swings. Statistically it is the p = -1 member of the power-mean family, with the arithmetic mean at p = 1 and the geometric mean as the limit at p = 0.
A worked example shows how quiet the difference usually is. For a window holding 98, 100 and 102 the arithmetic mean is exactly 100 while the harmonic mean is about 99.97, a gap invisible on any chart. Stretch the window to 50, 100 and 150 and the arithmetic mean stays at 100 while the harmonic mean drops to roughly 81.8. The divergence only becomes usable information when a window spans moves of tens of percent, which is why the harmonic MA distinguishes itself on crypto pairs, small caps and crash windows rather than on quiet large-cap charts.
In the LuxAlgo Library the harmonic mean mostly appears inside generalized moving average studies rather than as a standalone plot. BackQuant's Step Generalized Moving Average, the representative script here, exposes the power parameter directly, so a single input slides the same window smoothly from harmonic through geometric to arithmetic and beyond. That framing is the most honest way to think about the tool: not a rival signal engine to the EMA, but one point on a continuum of means whose choice encodes how much the average should respect dips versus spikes.
How to identify a harmonic MA on a chart
A harmonic MA looks like any other smooth line, so identification is really about knowing when it genuinely differs from its arithmetic sibling and confirming the data it is fed is suitable.
- 1Plot the harmonic MA and an SMA of the same length together; in a quiet range the two should be nearly indistinguishable, which confirms the implementation is correct rather than broken.
- 2Watch what happens after a sharp selloff enters the window: the harmonic line should sag visibly below the SMA, because reciprocal averaging lets the low prints dominate the calculation.
- 3Check the ordering. At every bar the harmonic mean must sit at or below the geometric mean, which sits at or below the arithmetic; any crossing between the three signals a calculation error.
- 4Confirm the input is strictly positive raw price. Feeding returns, spreads that cross zero or oscillator values breaks the math, since a single near-zero value drags the mean toward zero.
- 5If the script is a generalized mean, sweep the power input from 1 down to -1 and watch the line lean progressively toward the lows; the harmonic MA is the p = -1 endpoint of that sweep.
How it's calculated
A moving average that takes the harmonic mean of the last n prices, giving lower prices more influence than an arithmetic average does.
For positive inputs the harmonic mean never exceeds the geometric or arithmetic mean, so the line sits at or below an SMA of the same length and damps upward spikes.
The calculation is undefined if any price in the window is zero and unstable for prices near zero, so it suits price series rather than series that cross zero.
How traders use it
- As a variant smoother in generalized-mean studies that sweep the power parameter to compare arithmetic, geometric and harmonic responses on the same series.
- For averaging ratio-like series (valuation multiples, spreads, rates), where the harmonic mean is often the statistically appropriate average and the arithmetic mean overstates.
- As a conservative baseline when downside sensitivity is wanted: the line discounts upside outliers within its window rather than chasing them.
- As a drop-in leg in moving average crossovers research, where swapping the slow leg to a harmonic mean makes bearish crosses trigger slightly earlier after sharp dips; treat any improvement as something to verify, not assume.
- As the midline of an MA envelope when the study should lean toward the lower half of recent trade, keeping the band center conservative in volatile downtrends.
Harmonic MA vs other moving averages
SMA: Same window, same lag, different mean. The SMA weights every price equally in level terms; the harmonic mean works in reciprocal space, so dips pull it down more than rallies lift it. On typical windows the two overlap almost exactly.
EMA: The EMA changes the weighting through time, favoring recent bars to cut lag. The harmonic MA keeps flat weights and changes the type of mean instead. They answer different questions, and a harmonic average of exponentially weighted terms is a legitimate hybrid.
Ehlers SuperSmoother: The SuperSmoother is a filter-design solution that targets passband behavior and minimal aliasing. The harmonic MA is a statistics-first choice about outlier treatment. For lag and noise control the filter wins; for principled averaging of ratios the mean wins.
Concept family
Trend
100 concepts mapped · 100 in the Library
Harmonic MA FAQ
Turn Harmonic MA into a trading strategy.
Take the implementation from this page into Quant, then build on it, backtest it on real data, and keep refining it in conversation.