Concept
Gann Square of 9
Gann Square of 9 is a Trend concept. The Library holds 1 implementation, a working definition you can pull into Quant.
Top Gann Square of 9 indicator
The top custom implementation, built on the original standard Gann Square of 9 formula.
1 total
The Gann Square of 9 implementation below can become a backtested trading strategy — describe your rules and Quant writes the code.
What is the Gann Square of 9?
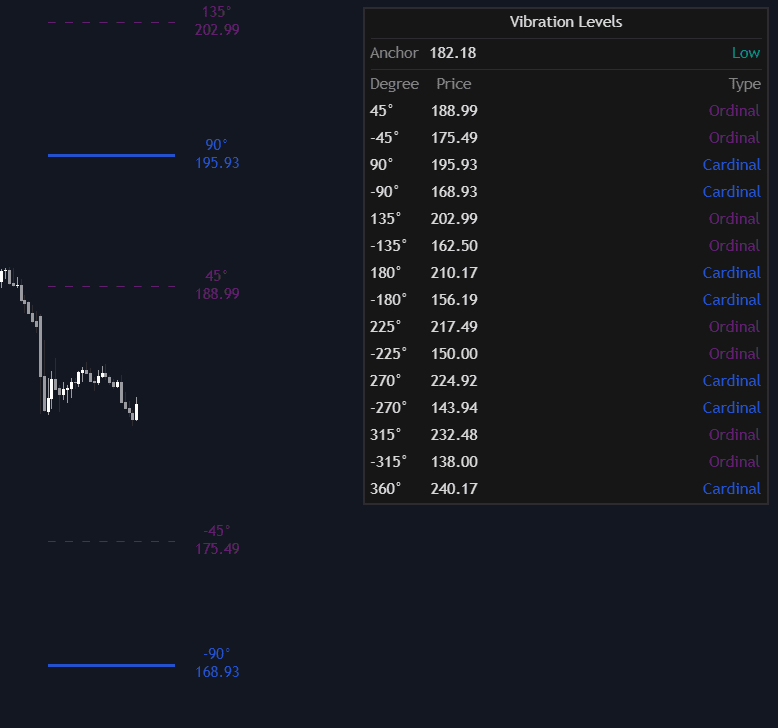
The Gann Square of 9 is W.D. Gann's number spiral: integers wind outward from 1 at the center, and numbers falling on the same angle of the spiral are treated as harmonically related prices. The geometry reduces to square-root arithmetic. Moving one full 360-degree rotation out along the spiral adds 2 to a number's square root, so a 180-degree step adds 1, 90 degrees adds 0.5, and 45 degrees adds 0.25. Practitioners take the square root of an anchor price (a significant high or low), add or subtract these increments, and re-square to generate candidate levels, sometimes called vibration levels, at each angle.
The wheel is attributed to William Delbert Gann (1878-1955), the American commodities and stock trader whose courses and master charts circulated among paying students in the first half of the twentieth century. Gann published no complete rulebook for it; what survives are course sheets, the calculators he sold, and decades of reconstruction by later authors, which is why modern treatments disagree on details such as scaling and anchor selection. Stories about Gann's own trading results are largely promotional and contested, so the tool is best judged on what it demonstrably does: generate a reproducible ladder of prices from a single anchor.
Gann tied the wheel to both price and time, looking for dates when a market had traveled a square relationship from its anchor. There is no accepted market mechanism behind any of this, and the wheel generates many levels, so hits are easy to find after the fact. The workable reading treats Square-of-9 outputs like any other derived level: candidate prices that earn attention only when the tape actually reacts there, a rejection that develops into a reversal or a decisive close through the level that reads as a breakout, ideally in confluence with independent evidence.
It also occupies a different niche from the tools most platforms lead with. A moving average such as an SMA or EMA follows price and updates every bar, and a trailing system such as Supertrend reacts to what has already happened. The Square of 9 instead fixes static targets in advance from one number, which is precisely why it attracts both devotion and skepticism: the levels are known ahead of time and therefore falsifiable, and nothing about the market is obliged to respect them.
How to calculate Gann Square of 9 levels
The spiral itself is rarely drawn; the square-root shortcut produces the same levels directly.
- 1Choose an anchor, a significant swing high or swing low, and take the square root of that price.
- 2Add (for levels above) or subtract (for levels below) the rotation increments: 0.25 for 45 degrees, 0.5 for 90, 1 for 180, and 2 for a full 360-degree rotation.
- 3Square each result to convert back to price; the outputs are the Square-of-9 levels for that anchor, and further rotations extend the ladder.
- 4Rescale first if the arithmetic degenerates: very low-priced or very high-priced instruments are commonly multiplied or divided by a power of ten before taking roots.
- 5Audit the output against history: keep the ladder only if past swings show repeated, unprompted reactions near its rungs, and discard anchors that produce a grid the market has ignored.
How it's calculated
Projects support and resistance levels by rotating a price around a square-root spiral of numbers.
Moving one ring outward along the same ray adds about 2 to the square root of the cell value, which is where the +2 per 360 degrees comes from.
Anchor choice and decimal scaling are discretionary, so published levels differ between practitioners.
The same wheel is also read against calendar dates and cardinal angles for time analysis.
How traders use it
- As a level map: anchor on a major pivot and mark the 90, 180 and 360-degree prices as candidate support and resistance, watching for actual reactions before trusting them.
- For confluence: a Square-of-9 level landing near independent evidence, a prior high, a fib, or a round number, is taken more seriously than one standing alone.
- In time work: counting calendar or bar spans that square price and time from the anchor; this is the most speculative part of the method and is best treated as a watch window, not a forecast.
- As trade framing around a level: reactions at a watched rotation are traded like any level test, with entry on the rejection and invalidation beyond the level, rather than as a standalone signal from the wheel itself.
- With a trend filter: an MA slope filter or trend regime label decides which side of the ladder is tradable, so in an uptrend the lower rotations are watched for buyable reactions instead of shorting into strength at the upper ones.
Gann Square of 9 vs other ways of projecting levels
Trendline: A trendline is drawn from two or more actual pivots and evolves with the swing structure; the Square of 9 needs one anchor and a formula. Both depend heavily on the operator's choice of starting points.
Dynamic S/R Via MA: Moving averages supply support and resistance that drifts with price and recalculates every bar. Square-of-9 levels are static once projected, which makes them testable in advance but blind to new information.
Supertrend: Supertrend is a trailing state line for riding trends, not a forecast: it tells you where the current trend flips. The Square of 9 tries to say where price might turn before it gets there; the two answer different questions.
Concept family
Trend
100 concepts mapped · 100 in the Library
Gann Square of 9 FAQ
Turn Gann Square of 9 into a trading strategy.
Take the implementation from this page into Quant, then build on it, backtest it on real data, and keep refining it in conversation.