Concept
Gann HiLo Activator
Gann HiLo Activator is a Trend concept. The Library holds 1 implementation, a working definition you can pull into Quant.
Top Gann HiLo Activator indicator
The top custom implementation, built on the original standard Gann HiLo Activator formula.
1 total
From studying Gann HiLo Activator to trading it: take the implementation below into Quant and backtest it instantly.
What is the Gann HiLo Activator?
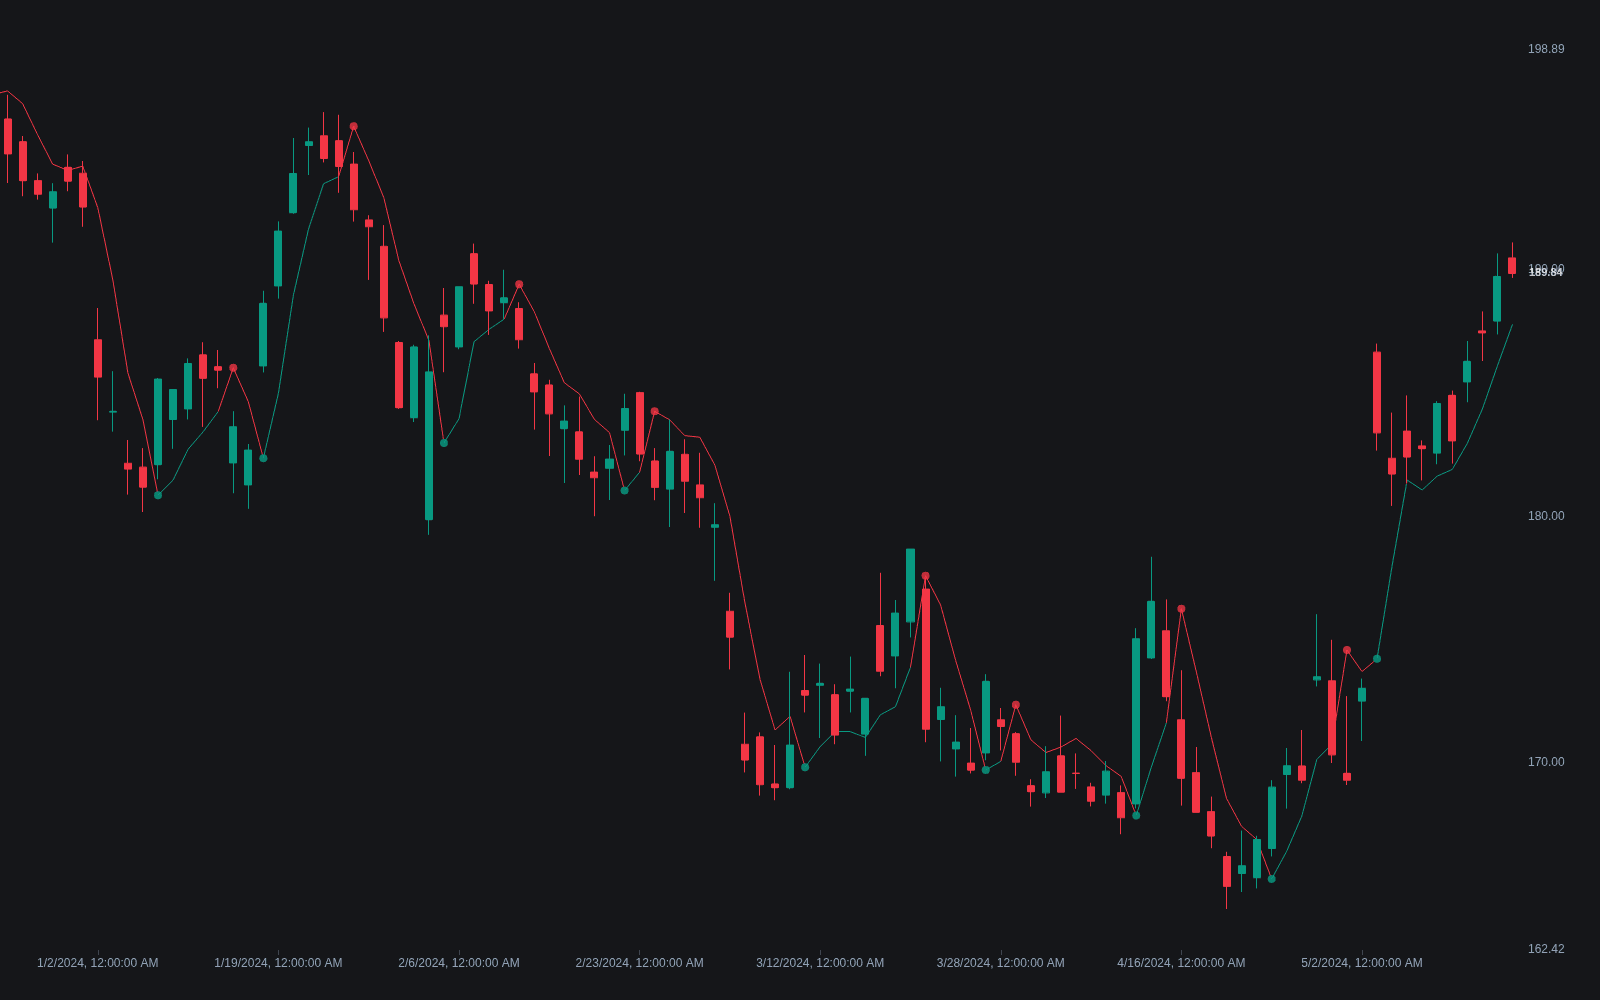
The Gann HiLo Activator is a trailing trend line built from two simple moving averages: one of the highs and one of the lows, each over a short lookback (3 periods is the common default). While the market is in an up state, the indicator plots the smoothed lows beneath price as trailing support; a close below that line flips the state, and the indicator switches to plotting the smoothed highs above price as trailing resistance. The result is a stepped line that hugs one side of price at a time and swaps sides only on a close through it.
Despite the name, it does not come from W.D. Gann's own writings. Robert Krausz introduced it in the 1990s as part of his Gann-inspired swing-trading work, and it reached a wide audience through a 1998 feature in Technical Analysis of Stocks & Commodities, where the line served as the stop and confirmation layer of his New Gann Swing Chartist plan. It has since become a standard alternative to volatility-based trailers such as Supertrend: it keys off smoothed highs and lows rather than an ATR multiple, so its distance from price adapts to recent bar range instead of an explicit volatility term.
Mechanically it is a compact state machine layered on two short SMAs. Every bar has two candidate values, the average of recent highs and the average of recent lows, and the current state decides which one is active and visible. Because only a close can flip the state, intrabar pokes through the line do not change it, which filters some of the noise that a stop resting exactly at the line would absorb. The one-sided, stair-stepped plot also makes it a simple form of dynamic support and resistance: in an up state the low-side line marks where pullbacks should hold, and in a down state the high-side line marks where rallies should stall.
Its appeal is parsimony. One short lookback controls everything, there is no acceleration factor to tune, and the flip rule is unambiguous, which makes the indicator easy to test and hard to overfit compared with multi-parameter systems. The trade-off is the usual one for tight trailers: in a trending market the line rides the move and keeps a position in, while in a range it flips repeatedly and bleeds small losses. Variants substitute other average types, such as an EMA or VWMA of highs and lows, or lengthen the lookback, and the same high/low-average idea underlies the SSL channel popular on forex forums, which plots both lines at once with a longer default.
How to identify the Gann HiLo Activator state on a chart
The indicator draws a single stepped line that is always on one side of price; reading it is a matter of knowing which side is active and when it flips.
- 1Apply the indicator with its default 3-period length. You should see one stair-stepped line hugging price, not a pair of averages weaving through the bars.
- 2Note the side: a line below the bars is the smoothed low series, meaning the state is up and the line is trailing support; a line above the bars is the smoothed high series, meaning the state is down.
- 3Watch for flips: the state changes only when a bar closes beyond the active line, after which the plot jumps to the opposite side. Mark recent flip bars to see the indicator's rhythm on that symbol.
- 4Judge the fit: several flips in quick succession mean the market is ranging and the settings are too tight for conditions, while long stretches on one side mean the line is tracking a usable trend.
How it's calculated
The Gann HiLo Activator is a stepped trailing line that flips between a short average of highs and a short average of lows as price changes sides.
Robert Krausz's original uses n = 3 with simple averages of the prior bars' highs and lows.
Some platforms average the current n bars instead of the prior ones, or offer EMA or SMMA smoothing; both shift the flip points slightly.
The flip of trend_t, price closing across the line, is the standard signal reading.
How traders use it
- As a trend-state switch: long bias while closes hold above the low-side line, short or flat once a close flips it, the same flip logic Parabolic SAR uses but without an acceleration factor.
- As a trailing stop: the active line is a ready-made stop location that moves with the smoothed highs or lows, tightening naturally when bars shrink and backing off when they widen.
- As a filter for faster entry triggers: breakout or crossover signals are taken only in the direction of the current HiLo state, with the lookback lengthened to slow the flips on noisy symbols.
- As a pullback map: in an up state, tests of the line that hold become entries in the trend's direction, the same way traders buy tags of a rising average.
- As one input in a regime read: pairing the flip state with a trend regime label or an MA slope filter screens out the flat conditions where tight trailers whipsaw worst.
Gann HiLo Activator vs other trend-following lines
Supertrend: Both are flip-on-close trailing lines, but Supertrend sets its distance as an ATR multiple while the HiLo Activator uses short averages of the highs and lows themselves. Supertrend gives explicit volatility control; the HiLo line sits closer to price and flips sooner.
EMA: A single EMA of closes gets crossed constantly in chop and carries no built-in state. The HiLo Activator separates the high and low sides and changes its reading only on a close through the active line.
Moving Average Crossovers: Crossover systems compare two averages of closes and lag by the slower length. The HiLo flip compares price itself with a short high/low average, so state changes arrive faster but whipsaw more in ranges.
Concept family
Trend
100 concepts mapped · 100 in the Library
Gann HiLo Activator FAQ
Turn Gann HiLo Activator into a trading strategy.
Take the implementation from this page into Quant, then build on it, backtest it on real data, and keep refining it in conversation.