Concept
R-squared Trend Fit
R-squared Trend Fit is a Trend concept. The Library holds 1 implementation, a working definition you can pull into Quant.
Top R-squared Trend Fit indicator
The top custom implementation, built on the original standard R-squared Trend Fit formula.
1 total
The R-squared Trend Fit implementation below can become a backtested trading strategy — describe your rules and Quant writes the code.
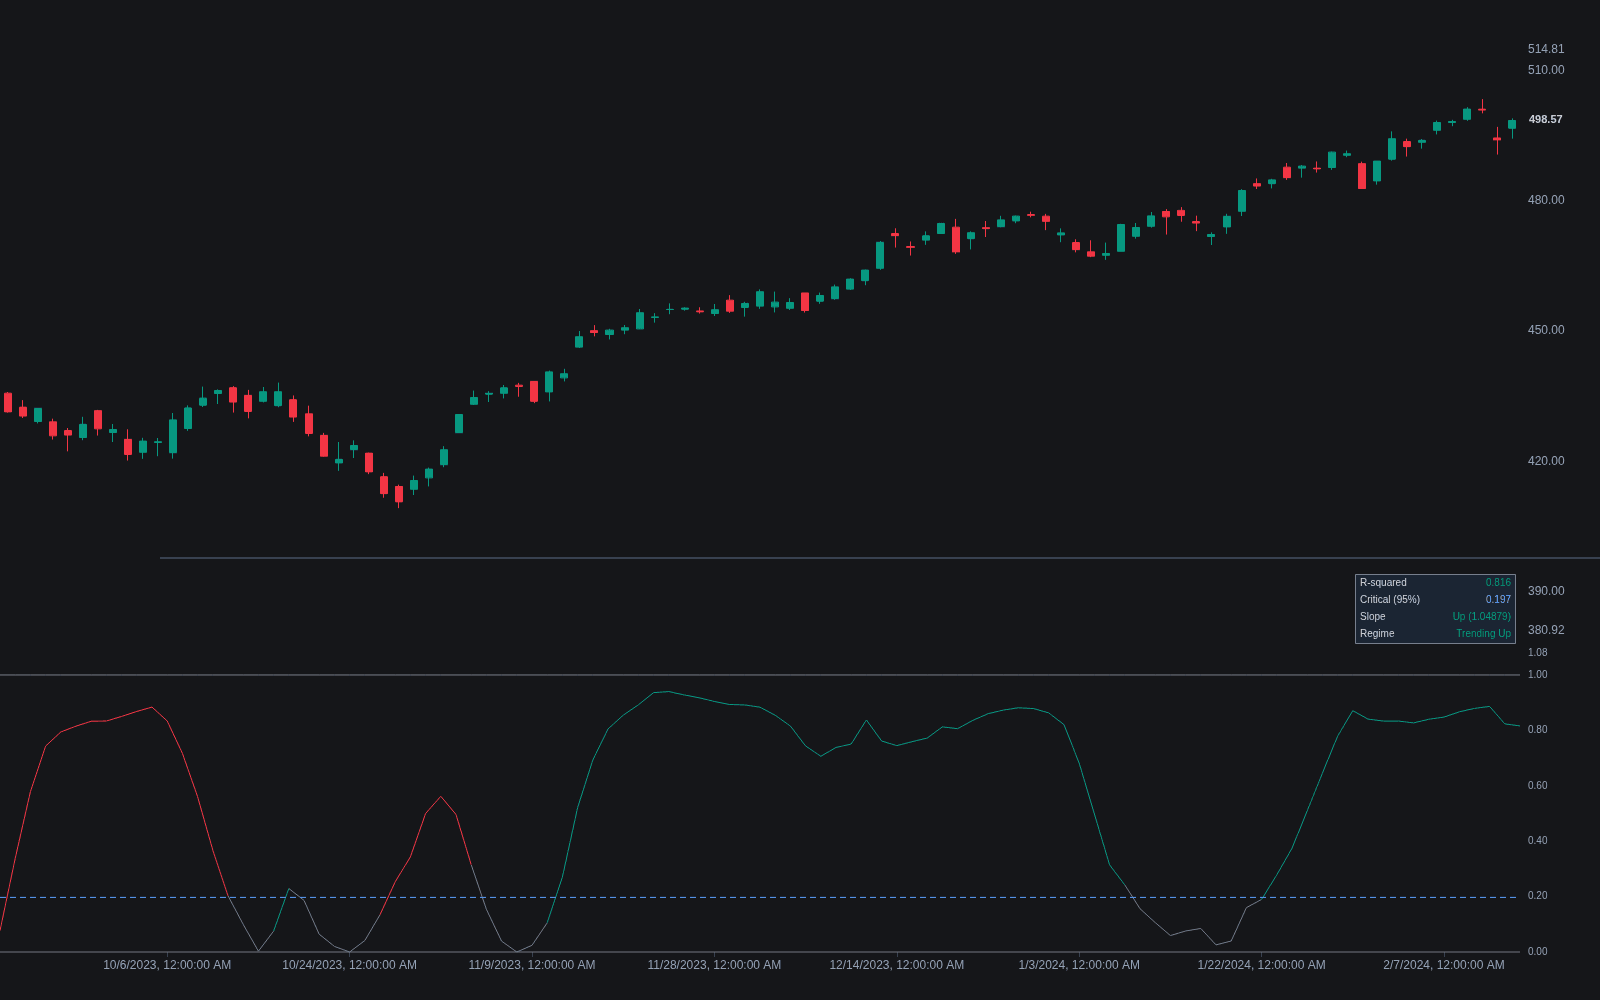
What is an R-squared trend fit?
An R-squared trend fit measures trend strength by running a linear regression of price against time over a lookback window and reporting R-squared, the fraction of price variance explained by the fitted line. The output runs from 0 to 1: near 1 means price moved almost exactly along a straight line through the window, near 0 means the line explains essentially nothing and the window was noise or range. Because the square discards the line's sign, R-squared is pure strength; direction comes from the regression slope, checked separately.
The construction borrows directly from statistics, and that lineage is its main appeal. R-squared has known sampling behavior, so instead of an arbitrary threshold a trader can ask whether the fit is statistically distinguishable from random data for the window length used. Published critical values exist for common lookbacks: shorter windows need higher R-squared before the trend reading means anything, longer windows clear significance at lower values. This puts trend-versus-no-trend on firmer footing than eyeballing a slope.
R-squared is the unsigned square of the Correlation Trend Indicator computed over the same window, and it is the same statistic that underlies the confidence one should place in an LSMA or a linear regression channel: a channel drawn through a low R-squared window is a line through noise, however clean it looks.
How it's calculated
R-squared is the squared Pearson correlation between the source series and the bar index over the lookback:
Both forms are algebraically identical for a simple regression on time.
Some traders regress the logarithm of price instead, which makes fits comparable across large percentage moves.
Direction is not in the output; pair R-squared with the sign of the regression slope.
How traders use it
- As a trend/no-trend gate: enable trend-following rules only when R-squared exceeds the critical value for the chosen window, and treat low readings as range conditions where mean-reversion logic applies.
- Combined with slope into a two-factor signal: rising slope with high R-squared qualifies a clean uptrend, while high slope with poor R-squared flags a jumpy, gap-driven move that trend entries handle badly.
- As a quality check before trusting regression-derived tools such as the standard error channel; channel projections mean little when the underlying fit explains a small share of variance.
- Falling R-squared after an extended trend is watched as an early sign of trend maturity, often before price violates any level. It is a decay symptom, not a reversal signal, and chop can persist long after the reading drops.
R-squared trend fit vs other strength measures
Correlation Trend Indicator: CTI is the signed square root of the same statistic: one bounded series carrying both direction and strength. R-squared isolates strength and leans on the slope for direction.
ADX/DMI system: ADX accumulates smoothed directional movement and reacts slowly at both ends of a trend. R-squared is a direct windowed fit with a statistical interpretation and a hard 0-to-1 scale.
Choppiness Index: The Choppiness Index infers trendiness from how range compounds across the window, without fitting any line. R-squared asks specifically about linear fit, so the two can disagree on curved but directional moves.
Vertical Horizontal Filter: The VHF compares net range to the sum of bar-to-bar movement, a path-efficiency idea. R-squared measures how well a straight line explains the path, penalizing even efficient moves that bend.
Concept family
Trend
100 concepts mapped · 100 in the Library
R-squared Trend Fit FAQ
Turn R-squared Trend Fit into a trading strategy.
Take the implementation from this page into Quant, then build on it, backtest it on real data, and keep refining it in conversation.