Concept
Chande Kroll Stop
Chande Kroll Stop is a Trend concept. The Library holds 1 implementation, a working definition you can pull into Quant.
The standard Chande Kroll Stop indicator
Chande Kroll Stop exactly as classically defined: the faithful reference build of the original formula, free to run in Quant.
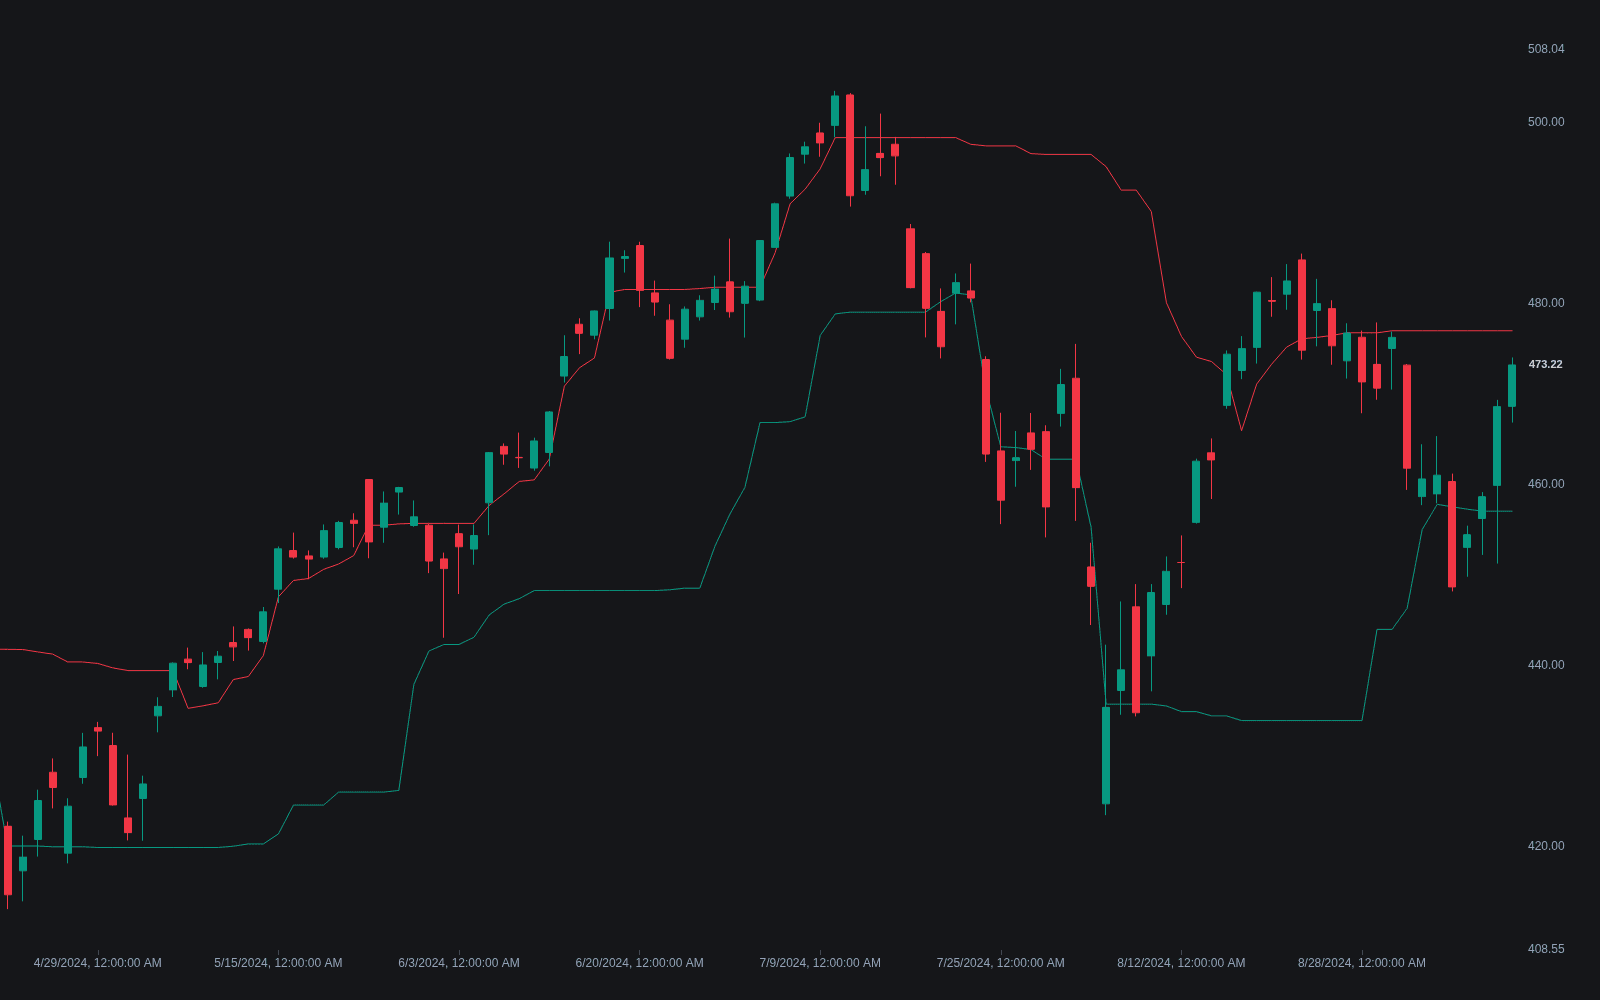
What is the Chande Kroll stop?
The Chande Kroll stop is a volatility-based trailing stop that plots two lines on the chart: a stop for long positions below price and a stop for short positions above it. Introduced by Tushar Chande and Stanley Kroll in their 1994 book The New Technical Trader, it anchors each stop to the recent extreme of price, offsets it by a multiple of ATR, and then smooths the result by taking the most conservative value over a second window. The two-stage construction is the distinctive part: the extra highest/lowest pass keeps the stop from loosening the moment volatility contracts.
The design goal is the standard one for volatility stops: place the exit far enough away that ordinary noise does not trigger it, but close enough that a genuine reversal is not allowed to run. Because both the anchor (recent extremes) and the offset (ATR) adapt to conditions, the stop widens in volatile markets and tightens in quiet ones without manual adjustment.
Traders also read the pair of lines as a regime display. Price holding above both lines suggests an uptrend, price below both suggests a downtrend, and price trapped between them marks indecision, which gives the tool a secondary role as a trend filter beyond exit management.
How it's calculated
Preliminary stops are built from recent extremes offset by an ATR multiple, then a second pass takes the most conservative value over q bars.
Defaults of p = 10, x = 1, q = 9 follow the common charting implementation; the original book presentation and platform versions vary in exact parameters.
Larger x widens both stops; larger q makes them slower to release after a volatility spike.
How traders use it
- As a trailing exit: longs are held while price stays above the long stop and closed when it closes below; shorts mirror this against the upper line. The second-pass smoothing means the stop ratchets rather than fluttering with every ATR change.
- As an entry filter: many users only take longs when price is above both lines and shorts when below both, treating the corridor between the lines as no-trade territory.
- As a stop-and-reverse frame: aggressive implementations flip position when price crosses from one side of the pair to the other, accepting whipsaw costs in ranges in exchange for never missing a large trend.
- Its limitations are those of every volatility stop: in tight congestion the two lines converge and produce alternating exits, and a single expansion bar can push the stop far from price, giving back open profit before the exit triggers. Position sizing should account for the stop distance actually plotted, not a fixed percentage.
Chande Kroll stop vs other trailing stops
Chandelier stop: The chandelier stop hangs a single ATR multiple off the highest high (or lowest low) with no second smoothing pass. The Chande Kroll construction adds the extra highest/lowest stage, which keeps the stop from stepping backward when volatility briefly contracts.
Supertrend: Supertrend collapses the same ATR-band idea into one flip-flopping line that is always either support or resistance. The Chande Kroll stop keeps both lines on screen simultaneously, which shows the neutral corridor Supertrend hides.
Parabolic SAR: Parabolic SAR tightens on a time-based acceleration schedule, so it eventually forces an exit even in a flat market. The Chande Kroll stop tightens only when price extremes and ATR justify it, so it can trail a slow trend indefinitely.
Concept family
Trend
100 concepts mapped · 100 in the Library
Chande Kroll Stop FAQ
Turn Chande Kroll Stop into a trading strategy.
Take the implementation from this page into Quant, then build on it, backtest it on real data, and keep refining it in conversation.