Concept
UHL Adaptive MA
UHL Adaptive MA is a Trend concept. The Library holds 1 implementation, a working definition you can pull into Quant.
Uhl
Top UHL Adaptive MA indicator
The top custom implementation, built on the original standard UHL Adaptive MA formula.
1 total
From studying UHL Adaptive MA to trading it: take the implementation below into Quant and backtest it instantly.
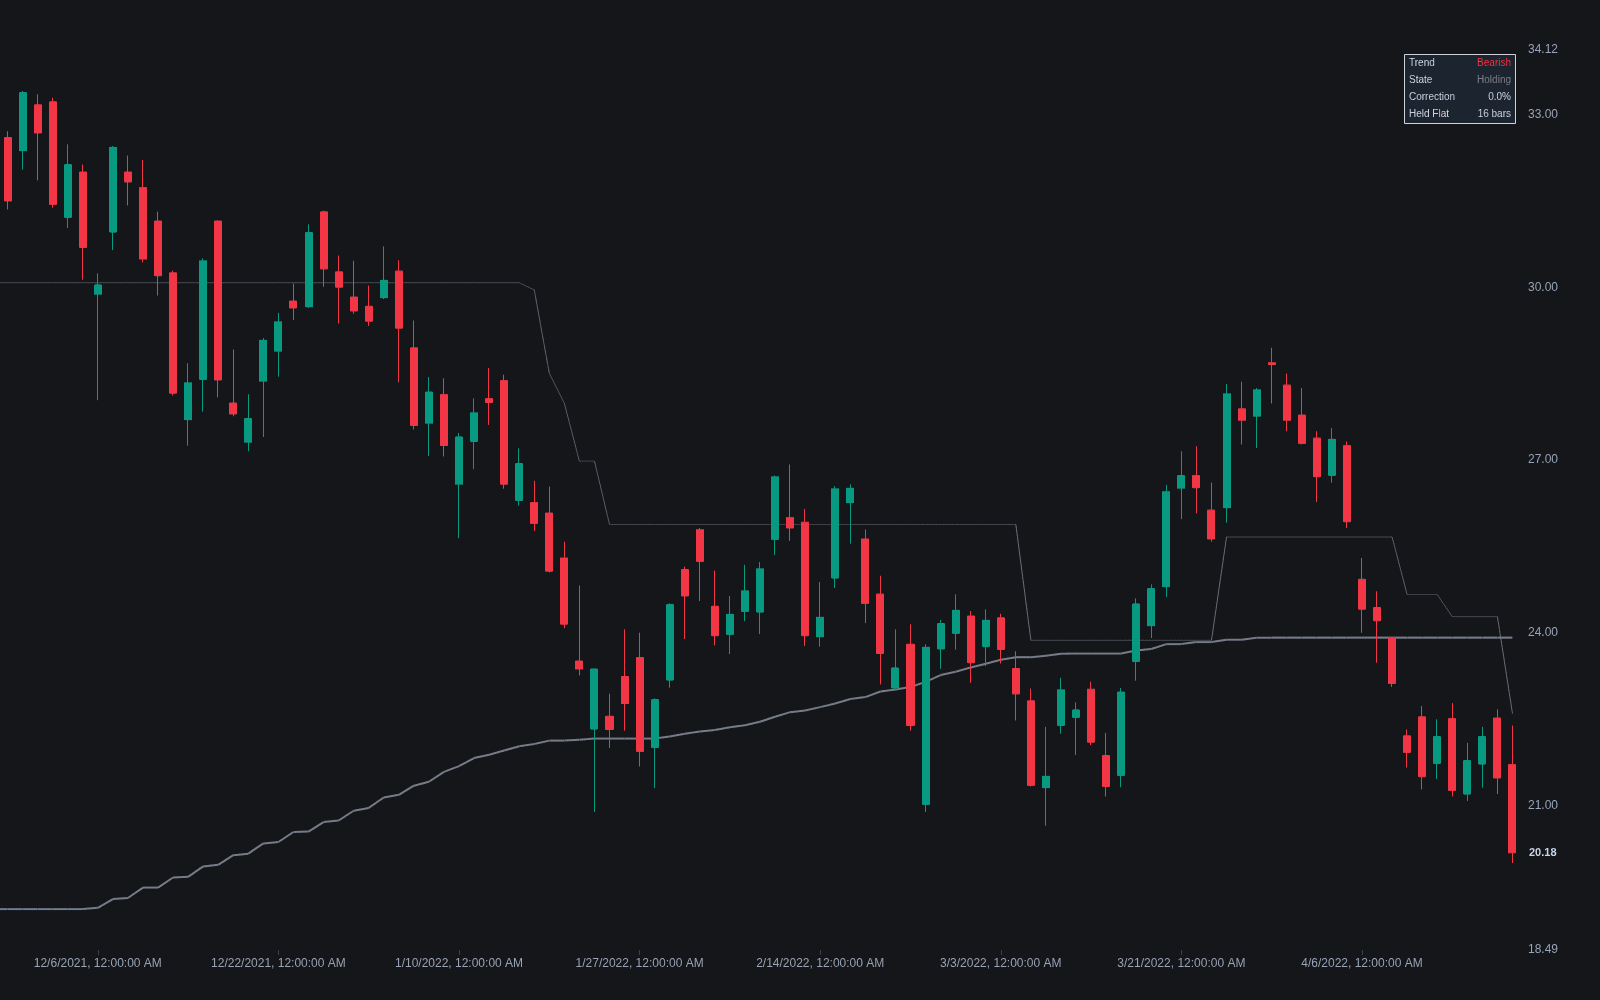
What is the UHL Adaptive MA?
The UHL Adaptive MA, credited to Andreas Uhl and often published as the corrected moving average (CMA), is an average that updates only when movement is statistically meaningful. Each bar, it compares the variance of price over the lookback with the squared distance between the average's previous value and its new target, typically the current SMA. If that distance sits within the variance, the correction factor is zero and the line simply holds its prior value; the further the distance exceeds the variance, the closer the factor gets to one and the faster the line converges on the target.
Formally it is an exponential-style update with a recomputed gain: the correction factor equals one minus the ratio of lookback variance to squared distance, floored at zero, and the line moves that fraction of the way toward the target. An EMA applies a fixed fraction every bar; the corrected average re-derives its fraction from the variance comparison, so it can sit perfectly still for stretches and then cover most of the distance in a single step.
The practical effect is a stepped average that ignores fluctuations inside the recent noise band and moves decisively once price escapes it. A common two-line form applies the same correction to raw price to get a faster trend-step line and to a slow simple average for the baseline, then reads crossings between the two as the signal version of the concept.
The design answers the oldest complaint about moving averages: a fixed length is too slow in trends or too twitchy in ranges. Adaptive averages attack the trade-off from different angles; an adaptive-lookback MA varies the window itself, while the Uhl correction fixes the window and varies the update size. The reward is an honestly flat line in consolidation, which makes downstream rules such as an MA slope filter or a trend regime label noticeably less noisy. The cost is bluntness: a trend that begins gradually can idle inside the gate for several bars.
How to Read the UHL Adaptive MA on a Chart
Reading it means telling genuine steps from flat holds.
- 1Apply the corrected average with a single lookback; that one length drives both the variance estimate and the SMA target.
- 2Check an obvious trading range: a correct implementation goes genuinely horizontal there, while an EMA of the same length keeps drifting with every oscillation.
- 3Treat the first step after a flat stretch as the event; it fires only when price outruns recent variance, so it often coincides with a breakout from the consolidation.
- 4In the two-line form, mark crossings of the fast corrected line built on price and the slow corrected baseline; the flat holds make those crossings sharper than fixed-length crossovers.
How it's calculated
A self-correcting average that moves toward its target only to the extent that the squared distance to the target exceeds the recent variance of price.
The corrected moving average is credited to Andreas Uhl of Salzburg University: while the move sits inside recent variance the correction factor is 0 and the line holds perfectly flat, then converges quickly once price escapes the noise band.
CMA corrects toward the SMA and acts as the slow line, CTS corrects toward raw closes and acts as the fast line; raising mult makes both lines harder to move.
Both recursive lines need a seed; published ports start them at the first close or SMA value.
How traders use it
- As a range-resistant trend filter: because the correction factor is zero while price oscillates inside recent variance, the line stays genuinely flat in consolidation, and slope changes only appear when movement outruns noise.
- As a crossover system: the fast corrected line (applied to price) crossing the slow corrected line (applied to a long simple average) defines bullish and bearish states, typically with fewer flip-flops than fixed-length moving average crossovers, though signals still lag turns.
- As a general smoothing stage: the variance-gated update can be applied to inputs other than price, giving any noisy series a version that only moves when change outruns the recent variance.
- As a dynamic support and resistance reference: because the line holds its level instead of chasing price, trend pullbacks tend to meet it in the same place repeatedly, a cleaner basis for dynamic S/R via MA tactics than a drifting average.
- As a quieter baseline inside larger systems: traders swap it in for the average in price-versus-baseline rules or Supertrend-style trailing logic, specifically to cut range churn.
UHL Adaptive MA vs Other Smoothers
EMA: An EMA moves every bar by a fixed fraction of its gap to price, so it drifts even in dead ranges. The Uhl correction recomputes that fraction from a variance test and zeroes it inside the noise band, trading response at slow turns for flatness.
Adaptive-lookback MA: Adaptive-lookback designs shorten or lengthen the window as conditions change, so the line always moves, at varying speed. The Uhl approach fixes the window and gates the update itself, producing steps and holds rather than a continuously bending curve.
Ehlers SuperSmoother: The SuperSmoother comes from filter theory and strips high-frequency noise with minimal lag, but it still updates every bar. The Uhl line is piecewise flat instead, which suits regime detection better and curve-following worse.
Concept family
Trend
100 concepts mapped · 100 in the Library
UHL Adaptive MA FAQ
Turn UHL Adaptive MA into a trading strategy.
Take the implementation from this page into Quant, then build on it, backtest it on real data, and keep refining it in conversation.