Concept
Anchored MA
Anchored MA is a Trend concept. The Library holds 1 implementation, a working definition you can pull into Quant.
Top Anchored MA indicator
The top custom implementation, built on the original standard Anchored MA formula.
1 total
This Anchored MA implementation is strategy-ready: open it in Quant, set your rules, and it backtests automatically.
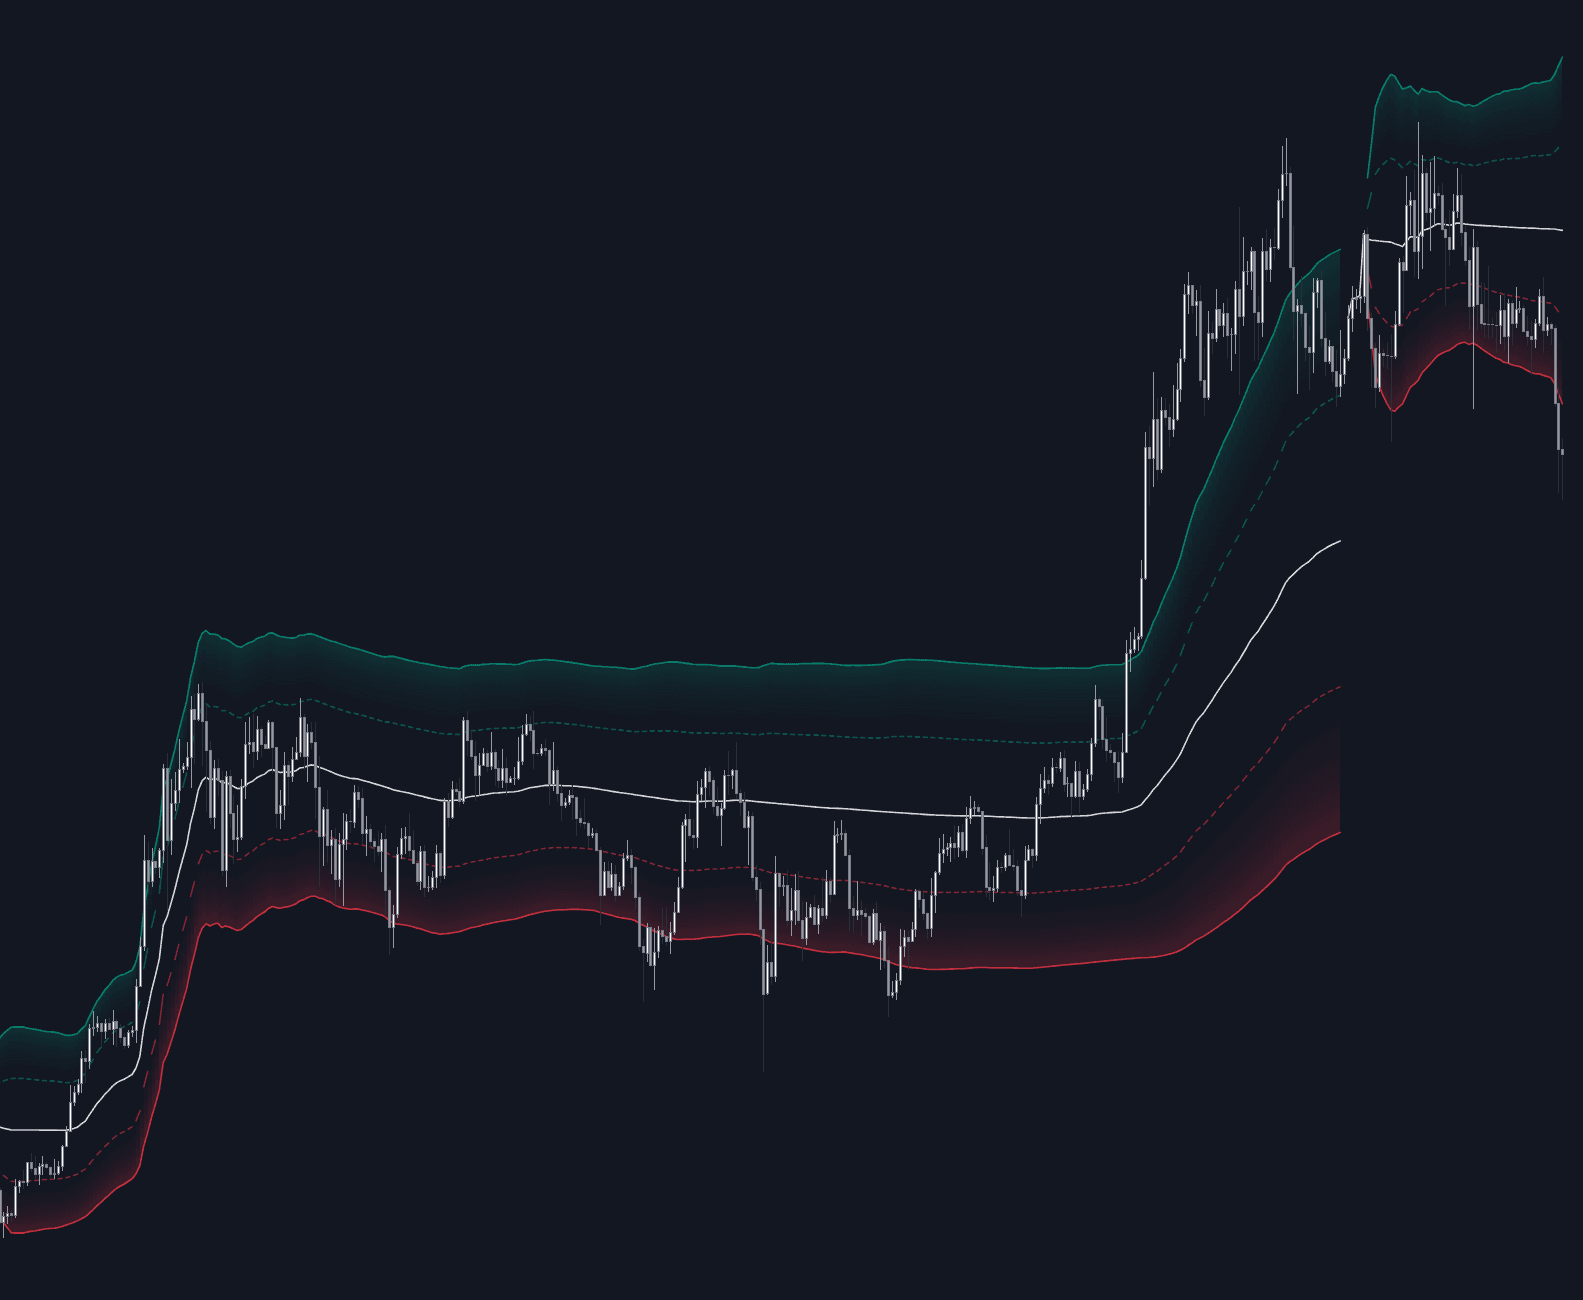
What is an Anchored MA?
An anchored moving average starts at a chosen event and averages every bar from that point forward, so its window expands instead of sliding. The anchor can be a session, week or year open, an earnings or news bar, a major swing high or low, or a breakout bar. It answers a different question from a rolling average: not what price has averaged lately, but what price has averaged since this event started mattering.
The best-known anchored average is the anchored VWAP, which weights each bar by its volume much as a rolling VWMA does; the plain anchored MA applies the same expanding-window idea to price alone. Fresh anchors produce a jumpy line, since few bars are in the mean; as bars accumulate, each new one moves the average less, so the line hardens into a slow reference for the entire move since the event.
The arithmetic is a cumulative mean: sum each bar's price since the anchor and divide by the bar count, a lookback that grows by one every bar. The idea generalizes: platforms offer anchored exponential and volume-weighted variants, and tools such as LuxAlgo's Anchored Powered KAMA apply the same anchoring logic to adaptive averages.
The appeal is that the reference comes from the market's story rather than a parameter. A 50-bar average answers what price has done lately with an arbitrary 50; an anchored average answers how price has traded since the event, no length to tune. It is the computed cousin of a trendline drawn from a major low: objective and reproducible where hand-drawn lines drift. The cost is anchor subjectivity: different anchors give different lines, which matter only as far as other participants track something similar.
How to set up an anchored moving average
Anchored tools need one decision a rolling average never asks for: where history starts.
- 1Pick the anchor event: a prominent swing high or low, an earnings gap or news bar, a breakout bar, or a scheduled open such as the year's first session.
- 2Apply an anchored MA and set the anchor to that bar; the line begins there and extends right, ignoring everything earlier.
- 3Discount the first stretch: with few bars in the mean the line whips around, so many users wait a few dozen bars before treating it as a reference.
- 4Re-anchor deliberately when a new event resets the story; on auto-anchoring tools, learn the swing definition, since re-anchoring redraws the whole line.
How it's calculated
The average price over an expanding window that starts at a chosen anchor bar.
The window grows by one bar each step, so the line reacts less the further it runs from the anchor.
Choosing a new anchor restarts the calculation from that bar.
Weighting each bar by its volume instead yields the anchored VWAP.
How traders use it
- As an event-relative trend reference: price holding above an average anchored to a major low says the advance has stayed above its own mean, while losing the line says price has slipped below the average of the entire move since the anchor, a caution rather than an automatic reversal signal.
- For dueling anchors: averages anchored at the last significant high and the last significant low bracket the market, and which line price respects is used as a rough control test between the two moves.
- At period opens: anchoring at the day, month, quarter, or year open yields calendar-to-date means that reset on schedule, a calendar-based way to frame trend.
- As a slow mean for pullbacks: the line anchored at a trend's origin becomes a deep-retracement reference, a steadier cousin of rolling dynamic S/R via MA, with reactions judged for continuation.
- In derived constructions: a fast rolling average crossing the anchored line flags recent trade departing from the whole-move mean, kin to moving average crossovers, and deviation envelopes around it frame stretch from that mean.
Anchored MA vs related moving averages
SMA: A simple moving average slides a fixed window: every bar eventually falls out and the line keeps adapting to recent conditions. An anchored MA fixes the start and lets the window grow, so nothing since the event is forgotten; the two agree only in passing, at the moment the expanding window matches the SMA's length.
EMA: An EMA never fully drops history but discounts it geometrically, staying responsive indefinitely. An anchored MA weights all post-anchor bars equally, so its responsiveness decays as bars accumulate, by design. One is built to keep up, the other to settle into a reference.
Adaptive-lookback MA: Adaptive averages also reject a fixed length, but volatility or efficiency measures resize their window continuously. An anchored MA resizes on discrete, human-chosen events: one adapts to market state automatically, the other encodes a judgment about when the regime began.
Concept family
Trend
100 concepts mapped · 100 in the Library
Anchored MA FAQ
Turn Anchored MA into a trading strategy.
Take the implementation from this page into Quant, then build on it, backtest it on real data, and keep refining it in conversation.