Concept
JMA
JMA, also known as Jurik moving average, is a Trend concept. The Library holds 1 implementation, a working definition you can pull into Quant.
Jurik
Top JMA indicator
The top custom implementation, built on the original standard JMA formula.
1 total
Want to trade JMA? The implementation below is one prompt away from a backtested strategy in Quant.
What is JMA?
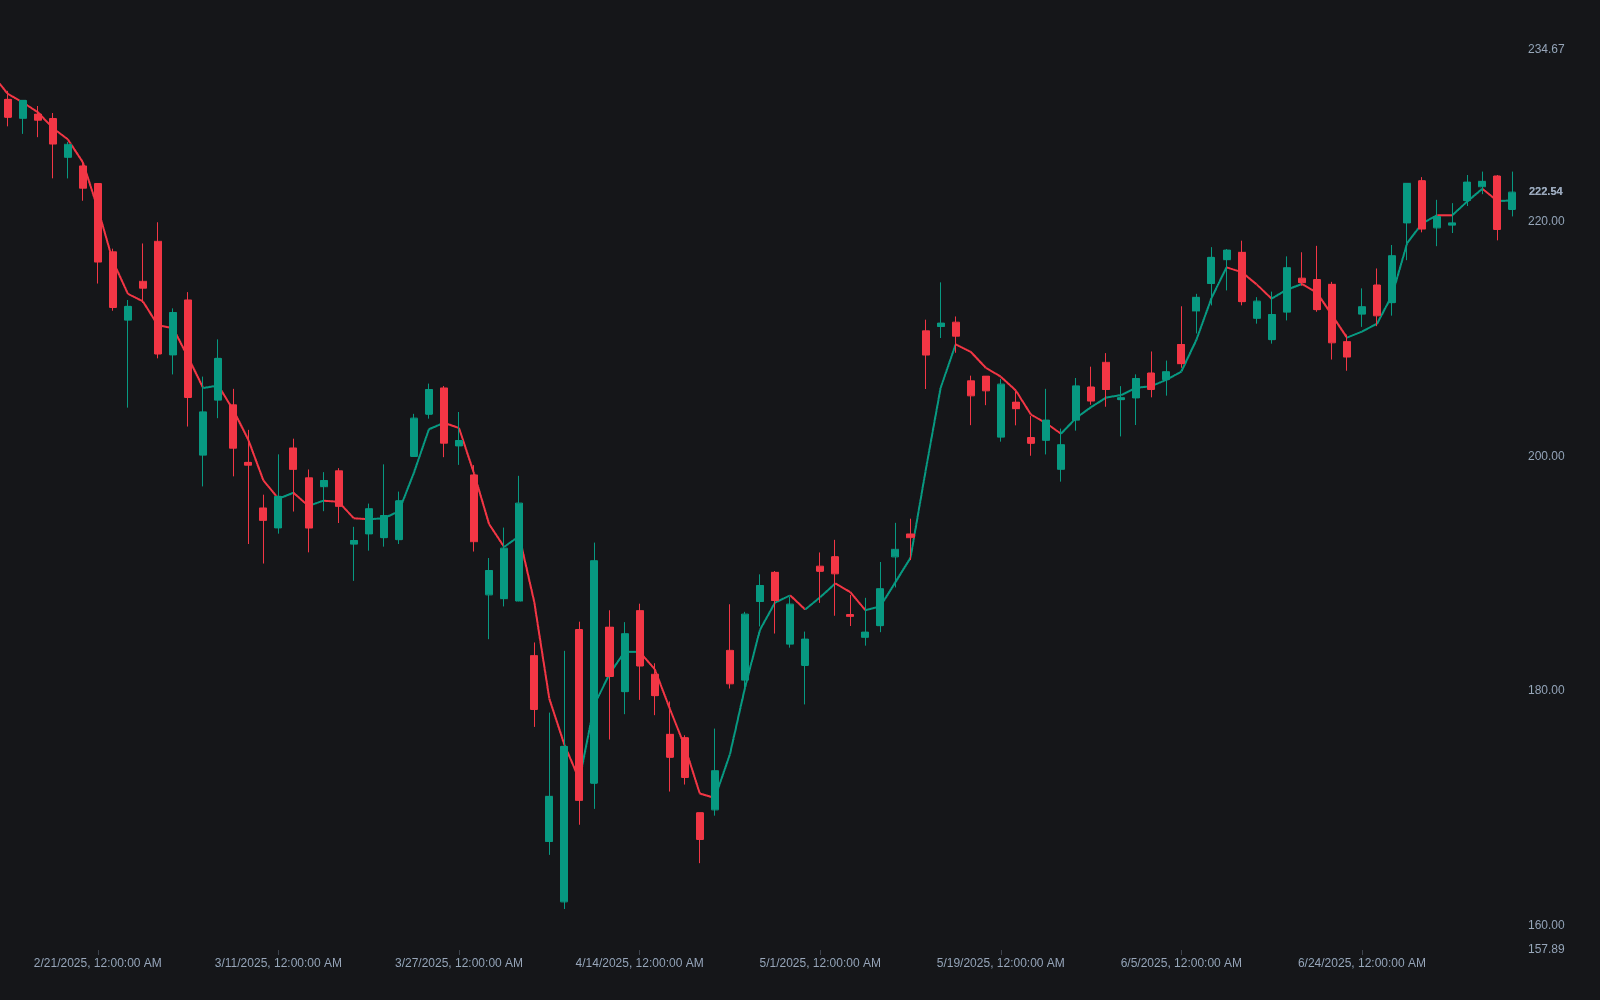
JMA (the Jurik Moving Average) is an adaptive moving average developed by Mark Jurik of Jurik Research. It attacks the trade-off every smoother faces: reducing noise means adding lag. Instead of weighting bars with a fixed scheme the way an SMA or EMA does, JMA adjusts its smoothing bar by bar in response to recent price behavior, hugging price through fast directional moves and flattening through congestion. The result is a curve designed to stay unusually smooth for how little it lags.
JMA comes from a signal-processing lineage rather than a charting one: Jurik Research, selling analysis tools to traders since the 1990s, marketed the average as a filter built to track a moving target the way navigation systems do, following genuine changes quickly while ignoring noise. Because the firm licensed the algorithm commercially instead of publishing it, JMA reached public charting platforms through independent open-source reconstructions.
Two things distinguish JMA in practice. First, the exact algorithm is proprietary: Jurik Research never published it, so the versions found on public charting platforms are reverse-engineered approximations that can differ slightly from one another. Second, common ports expose a phase input (typically from -100 to +100) alongside length: higher phase lets the average turn earlier at the cost of overshoot, lower phase suppresses overshoot at the cost of extra lag. That dial matters because no setting removes the trade-off; it only chooses where to sit on it.
The practical appeal is signal quality per unit of delay. A smoother line changes slope less often, so direction-keyed rules flip-flop less, and a lower-lag line turns closer to the actual swing, so the signals that fire are priced better. Tools built on top inherit that: a ribbon of JMAs fans out and compresses with less flicker than standard averages, and a trend regime label driven by the line's slope changes state less often in chop. None of that removes the constraint that smoothing trades information for stability; JMA negotiates the exchange well.
How to read JMA on a chart
JMA is a price overlay, so the reading is slope, flatness, and distance:
- 1Apply it as you would any moving average, choosing length for your timeframe; ports add a phase input, and some a power setting governing how aggressively the filter adapts.
- 2Read slope first: price above a rising line frames an uptrend, price below a falling line a downtrend; the turn of the line is the event most systems key on.
- 3Note flat stretches: JMA is designed to hold nearly level through congestion, so a horizontal line is a usable no-trend flag.
- 4Gauge extension by the distance between price and the line; a sharp move away from a still-flat JMA reads as stretch, not confirmed trend.
- 5Calibrate against a standard average of the same length: JMA should turn earlier at real swings while ignoring more of the noise between them.
How traders use it
- As a drop-in replacement for a standard moving average in crossover logic, aiming for similar smoothness at lower lag; whether that improves results depends on the market and must be tested, not assumed.
- As a trend baseline: price holding above a rising JMA (or below a falling one) sets directional bias, and the line's direction feeds slope filters and regime rules.
- As a smoothing core inside other tools: applying JMA smoothing to an oscillator such as RSI, or to a volume series, cuts noise before any signal logic runs.
- As dynamic support or resistance in trends, watching how pullbacks behave around the line; like any moving average, it marks a zone of interest, not a floor that must hold.
JMA vs other smoothers
Ehlers SuperSmoother: Both come from signal processing, but the SuperSmoother is a published, fixed two-pole filter that treats every bar the same. JMA is adaptive and proprietary: it changes behavior with conditions, and you cannot inspect how.
Adaptive-lookback MA: Both adapt, with different levers. An adaptive-lookback average changes its effective window by an open, inspectable rule; JMA keeps its parameters and adapts internally through undisclosed volatility logic.
EMA: The baseline case: fixed weights, one line of code, identical everywhere. JMA buys visibly more smoothness per unit of lag at the cost of complexity and version-to-version disagreement between ports.
Concept family
Trend
100 concepts mapped · 100 in the Library
JMA FAQ
Turn JMA into a trading strategy.
Take the implementation from this page into Quant, then build on it, backtest it on real data, and keep refining it in conversation.