Concept
HMA
HMA, also known as Hull moving average, is a Trend concept. The Library holds 1 implementation, a working definition you can pull into Quant.
Hull
Top HMA indicator
The top custom implementation, built on the original standard HMA formula.
1 total
The HMA implementation below can become a backtested trading strategy — describe your rules and Quant writes the code.
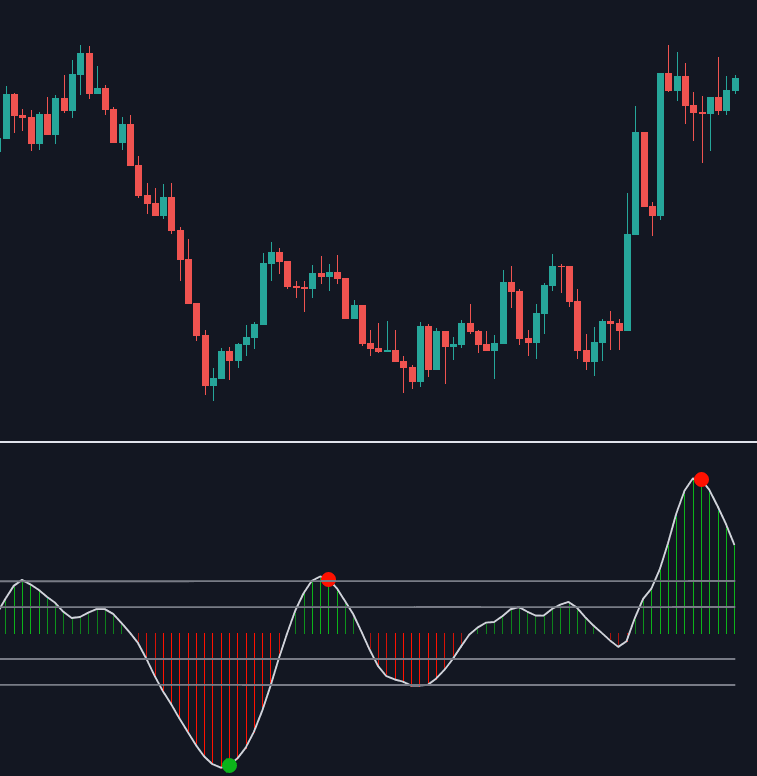
What is the HMA?
The HMA (Hull Moving Average) is a low-lag moving average published by Alan Hull in 2005. It is built entirely from weighted moving averages: take a WMA of half the chosen period, double it, subtract the full-period WMA, then smooth that raw series with a final WMA whose length is the square root of the period. The doubling-and-subtracting step extrapolates the average toward current price, cancelling most of the lag; the short final WMA tames the noise that extrapolation creates.
The result hugs price and turns quickly, which is why HMA slope, rather than price crossing the line, is the standard read: rising for bullish pressure, falling for bearish. The cost is overshoot. Because the formula is partly a projection, the HMA can hook beyond price at sharp V-turns and flip slope repeatedly in chop, where a slower EMA would simply flatten.
The HMA matters because it is one of the cleanest published answers to the central moving-average trade-off, smoothness versus lag. It serves as a baseline in trend systems, as the fast leg in moving average crossovers, and as a smoothing component inside other indicators, sitting alongside ZLEMA and JMA in the low-lag branch of the moving-average family.
How to calculate the HMA
The HMA takes one input, the period n, and is assembled from three weighted moving averages.
- 1Compute two WMAs of price: one over the full period n and one over the half period n/2, rounded to an integer.
- 2Form the raw de-lagged series: two times the half-period WMA minus the full-period WMA. This projects the average toward current price but leaves it noisy.
- 3Smooth the raw series with a WMA whose length is the square root of n, rounded. The output is the HMA.
- 4Read it by slope: charts commonly color the line by whether it rose or fell versus the prior bar, treating slope flips, not price crosses, as the event of interest.
How it's calculated
A weighted moving average that removes most lag by extrapolating a half-length average past the full-length one, then smoothing the result over sqrt(n) bars.
n/2 and sqrt(n) are rounded to whole numbers; platforms differ between rounding and truncating, which shifts values slightly.
The 2 × half-length minus full-length step is what cancels lag; the final sqrt(n) WMA restores smoothness.
The extrapolation makes the HMA overshoot around sharp turning points.
How traders use it
- As a slope-based trend filter: take longs only while the HMA rises and shorts only while it falls. This is the most common deployment, usually drawn as a color-flip line, and is a faster, noisier cousin of the MA slope filter.
- As the fast leg of a crossover pair: an HMA crossing a slower average fires earlier than an EMA of the same length, at the price of more false crosses in ranges.
- As a baseline bias line: price closing above or below a mid-length HMA sets directional bias while entries come from other triggers; it reacts faster than the equivalent dynamic S/R moving average but holds pullbacks less reliably.
- As a smoothing block inside other tools: HMA smoothing is regularly applied to oscillators, volume series, or volatility measures where a plain SMA would add too much delay.
HMA vs similar moving averages
EMA: The EMA reduces lag with exponential weighting but still trails price by construction. The HMA goes further by extrapolating, so it turns sooner and can overshoot; the EMA never overshoots but is always late.
ZLEMA: Both are de-lagging constructions. ZLEMA removes lag by error-correcting the input to an EMA, while the HMA subtracts a full-period WMA from a doubled half-period WMA and re-smooths the result.
WMA: The WMA is the HMA's building block: a single linearly weighted average that still lags. The HMA combines three WMAs specifically to cancel that lag out.
JMA: Both target minimal lag with maximal smoothness. The JMA is an adaptive, proprietary filter that adjusts to market conditions, while the HMA is a fixed, fully public formula anyone can reproduce.
Concept family
Trend
100 concepts mapped · 100 in the Library
HMA FAQ
Turn HMA into a trading strategy.
Take the implementation from this page into Quant, then build on it, backtest it on real data, and keep refining it in conversation.