Concept
Ichimoku Theories
Ichimoku Theories, also known as Time theory, Price/Wave theory, Sanjin principles, are Trend concepts. The Library holds 1 implementation, a working definition you can pull into Quant.
Top Ichimoku Theories indicator
The top custom implementation, built on the original standard Ichimoku Theories formula.
1 total
This Ichimoku Theories implementation is strategy-ready: open it in Quant, set your rules, and it backtests automatically.
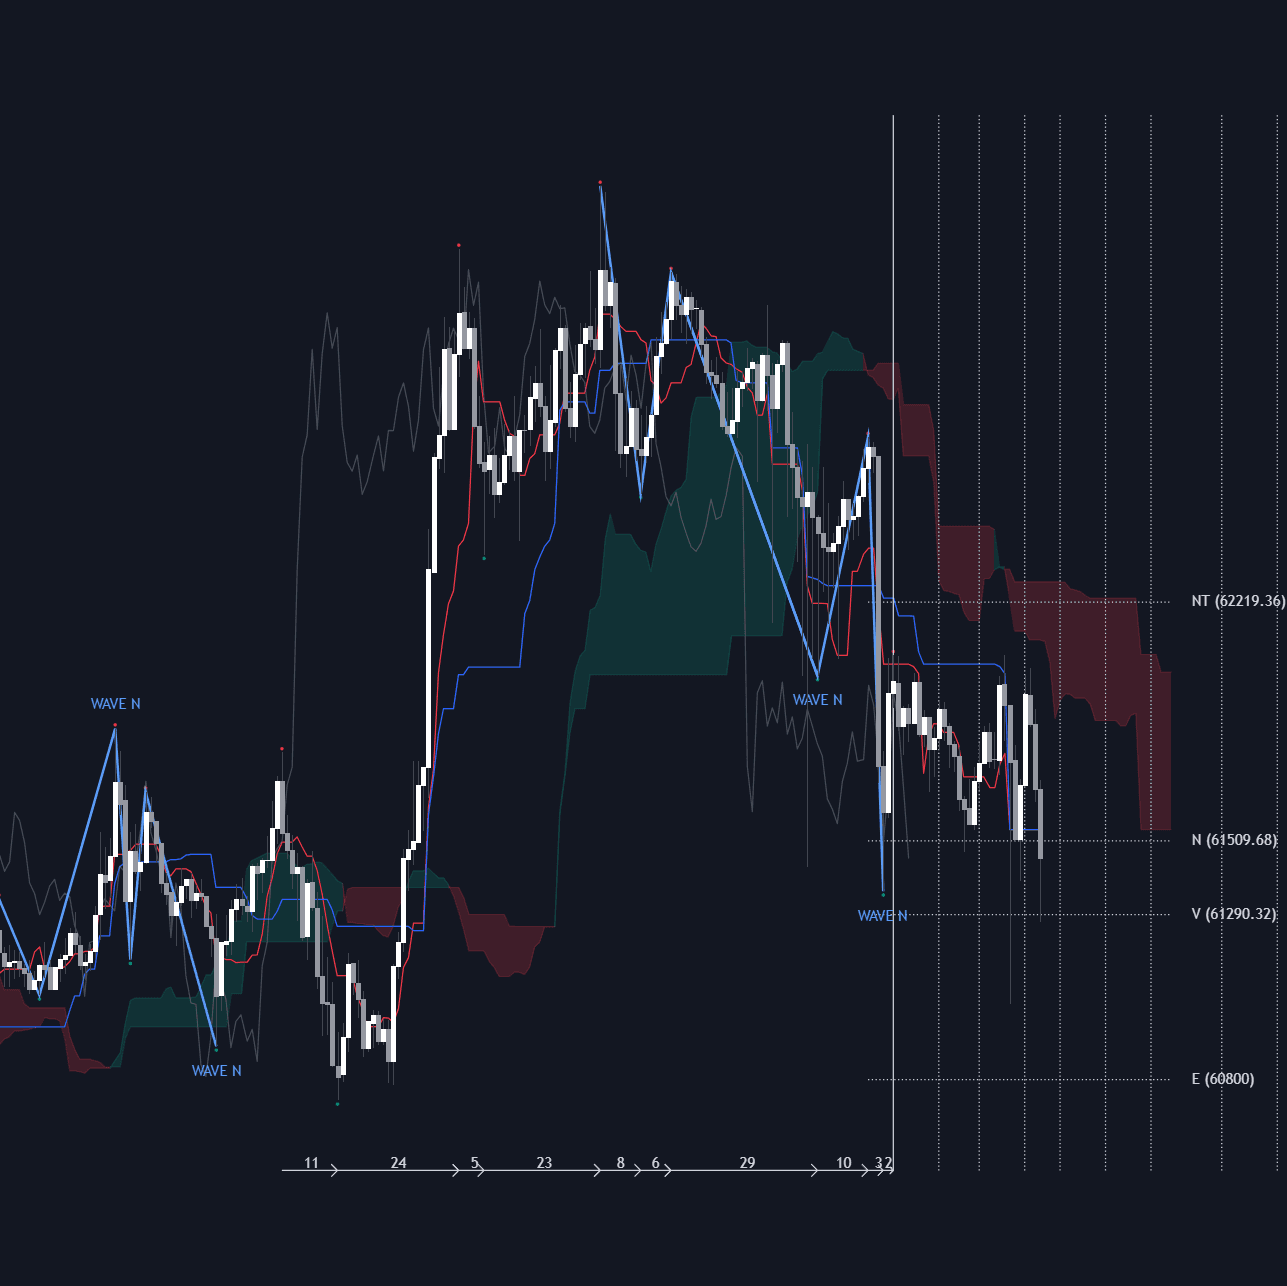
What are the Ichimoku Theories?
The Ichimoku Theories are the three doctrines Goichi Hosoda (who wrote as Ichimoku Sanjin) built beneath the five-line chart: time theory, wave theory, and price observation theory. Hosoda treated time as the dominant dimension. Time theory rests on his basic numbers (9, 17 and 26, with longer counts composed from them), counted forward from significant highs and lows to mark windows where a trend may turn, and on equalized spans, the idea that a developing phase often mirrors the length of a completed one. The familiar 9/26/52 settings of the Ichimoku System descend from these numbers.
Wave theory classifies movement into a grammar of I waves (one leg), V waves (two) and N waves (three, the basic trending unit), with contracting and expanding forms in fuller treatments. Price observation theory turns a completed A-B-C swing into four measured targets: N projects the first leg's length from the pullback low, E stacks that leg on top of its high, V doubles the correction's depth above the prior high, and NT projects the A-to-C span upward from C. Together the theories supply the forecasting layer that line-and-cloud reading alone, including the standard Ichimoku Signals, leaves out; every projection is a candidate window or objective, not a promise.
The history explains the system's texture. Hosoda developed the framework across decades of pre-computer research, famously employing a room of students to compute the lines and counts by hand, and published only in 1969 after years of refinement; the theories circulated primarily in Japanese, so English-language treatments vary in detail and completeness. The basic numbers extend beyond the simple three: composites such as 33, 42, 65 and 76 appear in fuller expositions, built from sums and overlaps of 9, 17 and 26, and the span-equalization principle, phases mirroring the durations of completed phases, runs through the whole time doctrine.
The three theories are designed to converge. A count window arriving while the current wave completes its N structure, with price approaching one of the four calculated targets, is the framework's full alignment, and the five-line chart itself encodes the time doctrine, the 26-bar displacement of the cloud being a basic number projected forward. In practice the theories survive mostly in automated form: the Library's Ichimoku Theories implementation labels waves, runs the counts and computes the N/V/E/NT objectives mechanically, which handles the bookkeeping the doctrines demand. The honest footing: these are Hosoda's conventions, coherent and venerable, with their forecasting value resting on practitioner tradition rather than audited statistics.
How to identify the Ichimoku theories at work
The three doctrines are applied as one workflow: label the wave, count the time, project the price.
- 1Label the swing structure: identify the working A-B-C sequence and classify the wave as I, V or N under the wave grammar.
- 2Run the counts: bars forward from significant highs and lows in basic-number increments, 9, 17, 26 and their composites, marking the turn windows they nominate.
- 3Check equalization: compare the developing phase's duration against completed phases, since mirrored spans are the time doctrine's second signal.
- 4Compute the objectives: N, V, E and NT targets from the labeled A-B-C, selecting among them by the wave's shape.
- 5Weight the confluences: a count window, a completing wave and a nearby calculated target arriving together is the framework's strongest read, and each alone is only a candidate.
How it's calculated
Hosoda's three companion theories to the Ichimoku chart: numbered time counts, wave classification, and four arithmetic price targets.
These are the Sanjin principles: time, wave, and price theories behind the standard Ichimoku lines, whose 9, 26, 52 lengths come from the same basic numbers.
E is read as the extended target, where the first leg's height repeats above B.
Change days flag dates where a trend may turn or accelerate; they do not indicate direction.
How traders use it
- Counting time: bars are counted from major pivots in basic-number increments to flag windows where turns become more likely, and phases are checked for equalized spans; kindred in spirit to other fixed time cycles work.
- Framing structure: swings are labeled with the I/V/N grammar so that targets and signals are applied to a defined wave rather than to noise.
- Setting objectives: the N, V, E and NT calculations give measured targets for the current wave, usually read alongside the cloud and cross signals rather than in isolation.
- In cloud confluence: calculated targets landing at cloud edges or line levels merge the forecasting layer with the standard chart, and such overlaps are ranked above either read alone.
- Automated: implementations that label waves, run counts and project the four objectives mechanically keep the doctrines applicable at modern pace, with the trader's judgment spent on which confluences deserve action.
Ichimoku theories vs related frameworks
Ichimoku System: The system is the five lines and cloud most charts show; the theories are the doctrines underneath, supplying the time counts, wave grammar and price objectives the lines silently encode. Reading the chart without the theories is using the interface without the engine.
Ichimoku Signals: The standard signals, crosses, cloud breaks, Chikou confirmations, are present-tense reads of line positions. The theories add the forecasting layer: when a turn window is due, which wave is completing, and where the measured objectives sit. Signals time entries; theories frame expectations.
Fixed Time Cycles: Hosoda's counts are a fixed-cycle tradition: constant bar intervals projected from anchors, with all the same honesty requirements about windows and confirmation. The distinctive additions are the composite number set and the span-equalization principle, which generic cycle counting lacks.
Concept family
Trend
100 concepts mapped · 100 in the Library
Ichimoku Theories FAQ
Turn Ichimoku Theories into a trading strategy.
Take the implementation from this page into Quant, then build on it, backtest it on real data, and keep refining it in conversation.