Concept
Tweezer Top/bottom
Tweezer Top/bottom is a Chart & Candlestick Patterns concept. The Library holds 1 implementation, a working definition you can pull into Quant.
Top Tweezer Top/bottom indicator
The top custom implementation, built on the original standard Tweezer Top/bottom formula.
1 total
The Tweezer Top/bottom implementation below can become a backtested trading strategy — describe your rules and Quant writes the code.
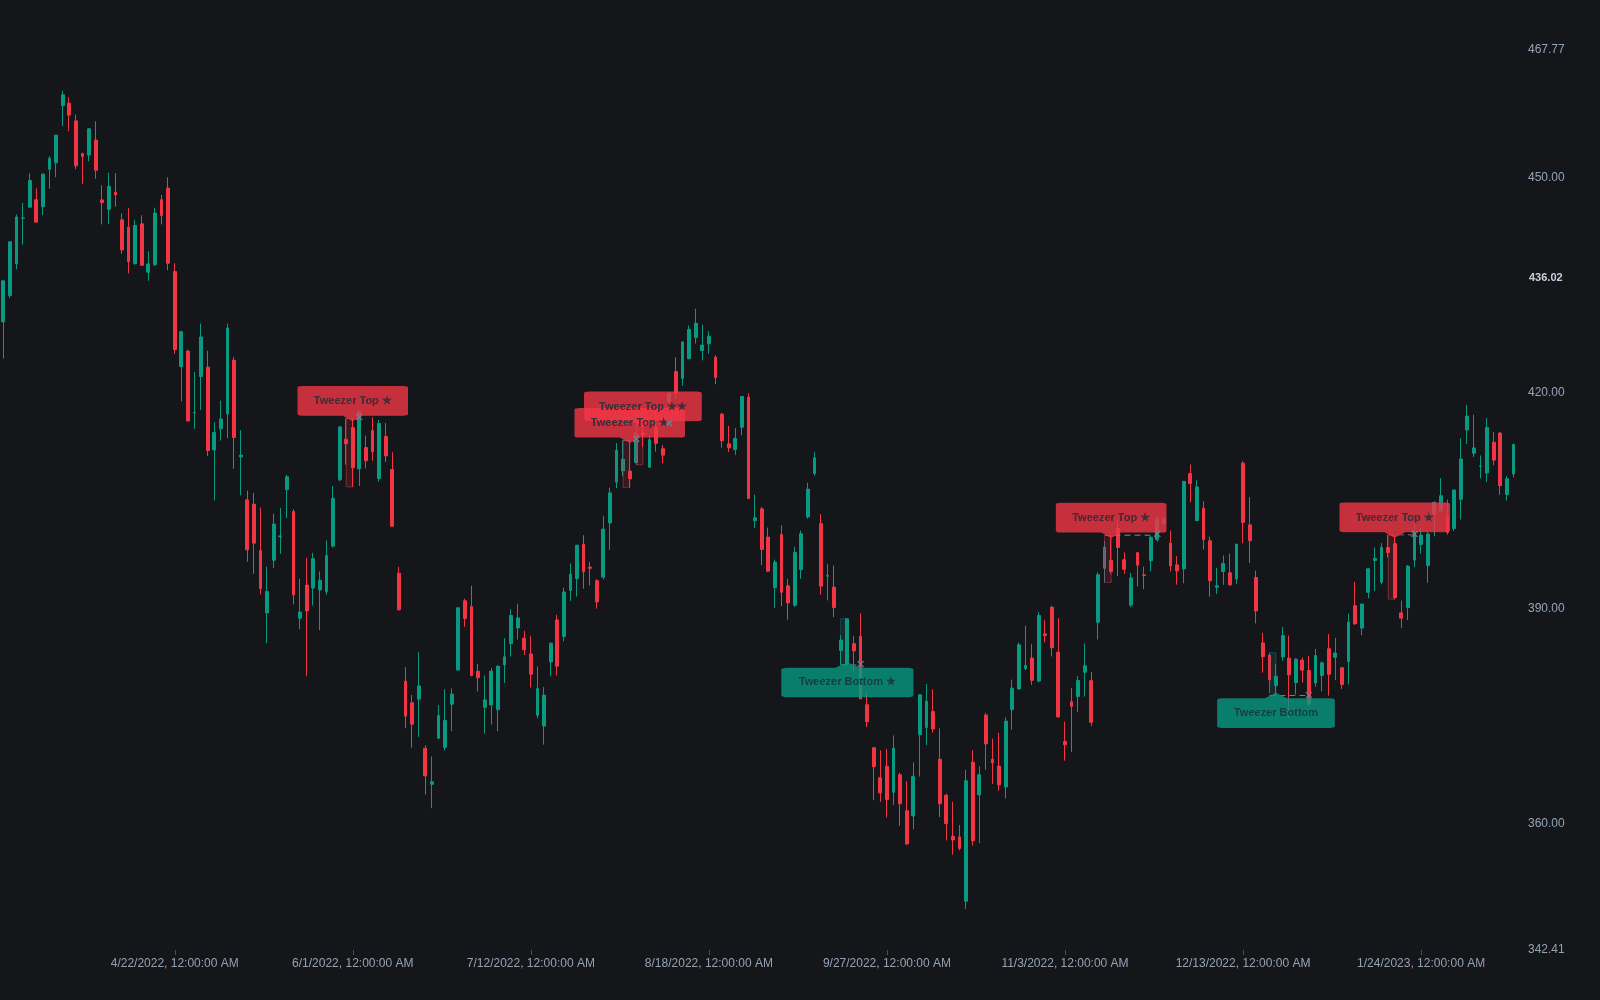
What are Tweezer Tops and Bottoms?
Tweezers are two-candle reversal patterns in which consecutive candles print matching extremes: a tweezer top puts two highs at essentially the same price after an advance, and a tweezer bottom puts two lows at the same price after a decline. The name comes from the Japanese candlestick tradition, where the twin prongs of the pattern were likened to tweezers, and the pattern reads as price probing the same level twice and being rejected both times.
The mechanism is a fast retest. The first candle pushes to an extreme; the second returns to that exact price and fails again, often with the opposite body color. Two rejections at one price in immediate succession suggest resting supply at a top or demand at a bottom that the trend could not absorb. It is the two-bar miniature of a double top or bottom, without the intervening swing.
Candlestick literature treats tweezers as a minor signal on their own, and honest practitioners agree: matching extremes occur constantly by chance, especially on lower timeframes and at round prices. The pattern earns attention mainly when the matched level coincides with something independently meaningful, such as a prior high or low, a moving average, or a zone where equal highs or lows mark visible resting orders.
How to identify tweezers on a chart
The defining feature is the matched extreme; body shapes and colors vary widely across valid examples.
- 1Require a preceding directional move; matched highs inside a flat range are routine noise.
- 2Find two consecutive candles whose highs (top) or lows (bottom) match to within a small tolerance for the instrument's tick size and volatility.
- 3Prefer versions where the second candle closes against the prior trend, for example a strong up candle followed by a bearish close at a tweezer top.
- 4Give extra weight when the candles also form another rejection shape, such as a shooting star at the top or hammer-like wicks at the bottom.
- 5Check the location: tweezers at a tested support or resistance level, or a higher-timeframe level, carry more meaning than tweezers in open space.
- 6Treat a close beyond the matched extreme as invalidation; the level the pattern is built on has failed.
How traders use it
- As a location-dependent reversal trigger: traders who already expect a turn at a level use the tweezer as the timing signal, entering on the close of the second candle or on a break of its body, with a stop just beyond the matched extreme.
- The matched extreme doubles as a clean risk anchor, since the trade thesis is precisely that this price holds; that makes position sizing straightforward.
- Some traders read failed tweezers as information: when price later runs through matched highs or lows, the move can sweep the stops resting there, a dynamic covered under liquidity sweeps.
- Standalone reliability is modest. Backtests of two-bar candlestick reversals generally show weak edges without context filters, so tweezers are best treated as confirmation rather than thesis.
Tweezers vs. neighboring patterns
Matching Low/High: The classical matching low/high requires two candles closing at the same price; tweezers match the wick extremes, which is the more commonly traded form.
Double Top/Bottom: A double top or bottom is the same twice-rejected-level logic played out over two separate swings with a reaction between them; tweezers compress it into adjacent bars.
Pin Bar: A pin bar shows one rejection through a long wick on a single candle; tweezers show two rejections at one price across two candles, and the strongest setups often combine both.
Concept family
Chart & Candlestick Patterns
84 concepts mapped · 84 in the Library
Tweezer Top/bottom FAQ
Turn Tweezer Top/bottom into a trading strategy.
Take the implementation from this page into Quant, then build on it, backtest it on real data, and keep refining it in conversation.