Weinstein Stage Analysis
Weinstein Stage Analysis, also known as stage analysis, Weinstein stages, Stage 2 breakout, four-stage cycle, are Trend concepts. The Library holds 1 implementation, a working definition you can pull into Quant.
Top Weinstein Stage Analysis indicator
The top custom implementation, built on the original standard Weinstein Stage Analysis formula.
1 total
Want to trade Weinstein Stage Analysis? The implementation below is one prompt away from a backtested strategy in Quant.
What is Weinstein Stage Analysis?
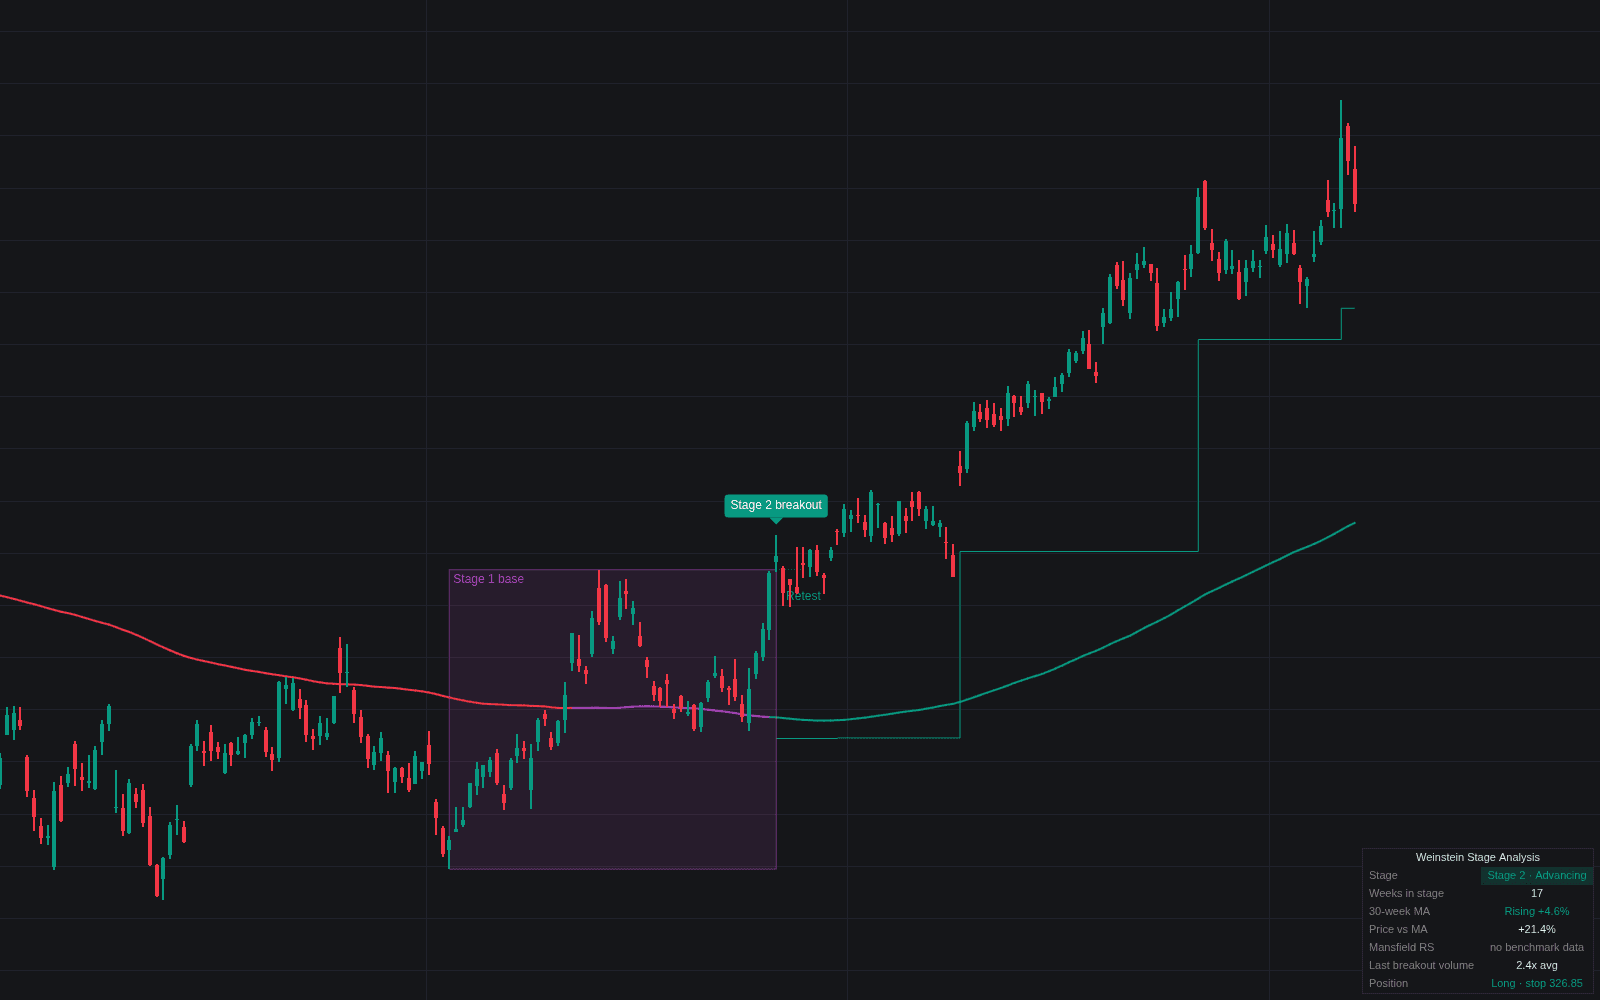
Weinstein stage analysis classifies a chart into one of four stages (Stage 1 basing, Stage 2 advancing, Stage 3 topping, Stage 4 declining) using weekly bars, the slope of the 30-week moving average, price's position against it, and relative strength versus the market. Stan Weinstein, longtime editor of The Professional Tape Reader newsletter, set the method out in his 1988 book Secrets for Profiting in Bull and Bear Markets, with a blunt core rule: buy in Stage 2, sell or short in Stage 4, stand aside in between.
Each stage has a signature. In Stage 1 the 30-week average flattens after a decline and price chops across it inside a base. Stage 2 begins when price breaks above the base on strong volume and holds above an average that has turned up. Stage 3 mirrors Stage 1 at the top: the average flattens and price whips around it. Stage 4 starts with the break below the top's support, price beneath a declining average. It is the Wyckoff cycle of accumulation, markup, distribution and markdown, stated in moving-average terms.
Relative strength is the second filter. Weinstein used the Mansfield form, the stock-to-index ratio normalized by its own 52-week average so it oscillates around zero: buy candidates should read positive or be turning positive, short candidates negative. He also worked top-down, from the market's stage to sector and industry groups to stocks, his forest-to-the-trees approach.
The framework is descriptive and lags by design. A Stage 2 breakout can fail back into its base, a Stage 3 top can resolve into a fresh advance, and a 30-week average needs weeks to change slope; buying confirmation always costs some price. Its value is discipline, keeping capital out of declining charts, rather than precision at turns. Later growth-stock methods kept the vocabulary: Mark Minervini's trend template is a checklist for confirming a Stage 2 uptrend.
How to identify the four stages
Read weekly bars with a 30-week simple moving average (a 150-day average is the usual daily-chart translation) and Mansfield relative strength against the benchmark index.
- 1Stage 1: after a decline the average flattens and price oscillates around it in a range; mark the range's resistance.
- 2Stage 2: price closes above that resistance on strong volume, the average turns up, relative strength moves above zero, and the advance makes higher lows.
- 3Stage 3: after an advance the average flattens and price crosses it repeatedly; mark the range's support.
- 4Stage 4: price closes below that support as the average rolls over; rallies that fail at the declining average confirm it.
How traders use it
- As a buy filter: long entries only on Stage 2 breakouts or pullbacks toward the breakout level, which removes basing and declining charts by construction.
- As a sell and short framework: Stage 3 is the cue to take profits or tighten, and the Stage 4 breakdown is Weinstein's short-sale entry.
- As a top-down screen: market stage first, from the indices and breadth such as the percentage of stocks above their moving averages, then group stages through sector rotation, then stocks.
- As a rule set: the stages map onto a trend regime label (range, up, range, down), so screens implement them as conditions on average slope, price position and the sign of relative strength.
Stage analysis vs related frameworks
Dow Theory: Dow Theory's phases describe the primary trend of the whole market, confirmed across the averages. Weinstein applies a four-stage cycle to every individual chart, keyed to one moving average.
Wyckoff Method: Wyckoff reads the same cycle through volume and the tests of a range, such as springs and upthrusts. Stage analysis trades that detail for a mechanical read of one average and relative strength.
O'Neil Base Analysis: O'Neil's base count tracks an advance's life by counting successive bases within one uptrend. Weinstein's stages cover the whole cycle, including the top and the decline that supply the short side.
Concept family
Trend
104 concepts mapped · 104 in the Library
Weinstein Stage Analysis FAQ
Turn Weinstein Stage Analysis into a trading strategy.
Take the implementation from this page into Quant, then build on it, backtest it on real data, and keep refining it in conversation.