Concept
Volume Flow Indicator
Volume Flow Indicator is a Volume & Order Flow concept. The Library holds 1 implementation, a working definition you can pull into Quant.
VFI
Top Volume Flow Indicator indicator
The top custom implementation, built on the original standard Volume Flow Indicator formula.
1 total
From studying Volume Flow Indicator to trading it: take the implementation below into Quant and backtest it instantly.
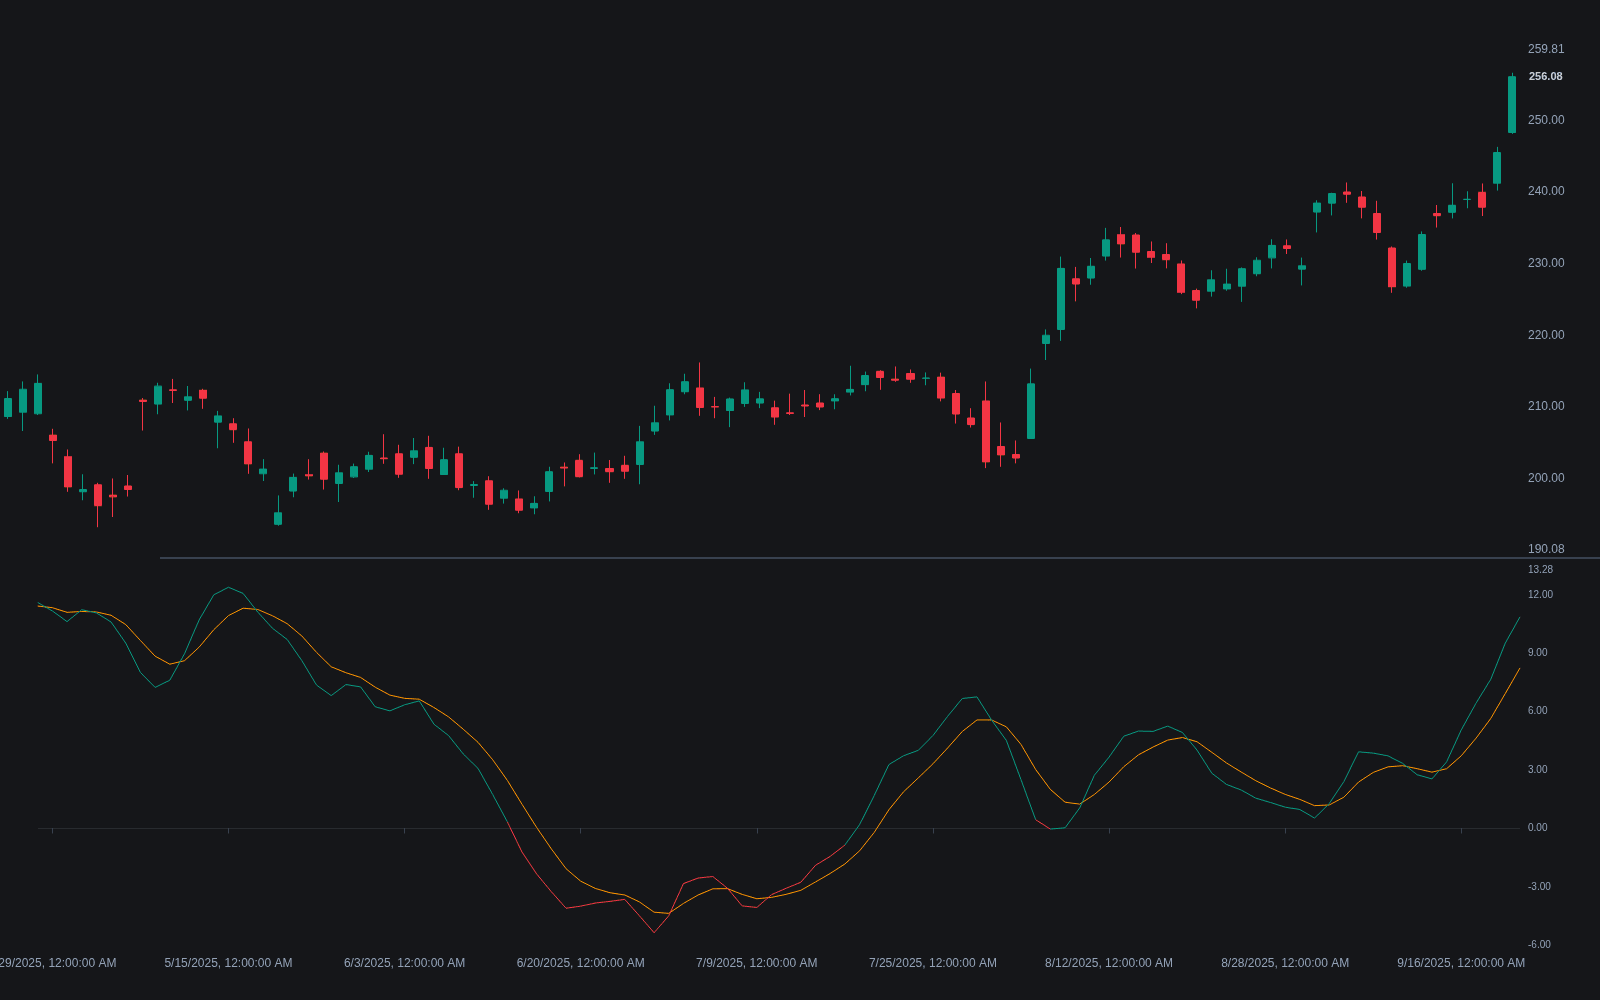
What is the Volume Flow Indicator?
The Volume Flow Indicator (VFI) is a volume-flow oscillator introduced by Markos Katsanos in 2004 as a refinement of the cumulative flow-line family that includes OBV and volume price trend. Each bar's volume is signed by the direction of the change in typical price (the average of high, low, and close) rather than the close alone, and only when that change clears a volatility-scaled cutoff; smaller fluctuations count as noise and contribute nothing. Volume is also capped at a multiple of its recent average so a single extreme print cannot dominate the reading.
Katsanos published the design in the technical-analysis press with an explicit bill of complaints against its ancestors: OBV lets a one-tick close change commit a whole bar's volume, ignores intrabar information, and lets climactic prints distort the line for months. VFI's three interventions, typical price, the volatility-scaled minimum change, and the volume cap, each answer one of those complaints, at the acknowledged price of slower response.
The signed, filtered volume is summed over a long rolling window (130 bars in the published version), scaled by average volume, and usually smoothed, producing a line that oscillates around zero. Readings above zero are read as net accumulation and readings below zero as net distribution; zero-line crosses and divergences against price are the standard signals. The filtering makes VFI steadier than raw OBV, at the cost of extra lag.
The published parameterization is a starting point, not scripture: the 130-bar window suits position-horizon work on daily charts, shorter windows trade steadiness for responsiveness, and implementations differ on the smoothing and on signal-line additions. The usual volume caveats apply with full force, since every one of VFI's filters still operates on whatever volume series the venue reports, and tick-proxy or fragmented feeds change what the line can honestly claim to measure.
How to read the Volume Flow Indicator
VFI plots around zero in its own pane; the reading is regime first, divergence second.
- 1Add the indicator with the published defaults (130-bar window, smoothing on) or note explicitly what the implementation changed.
- 2Read the zero line as the flow regime: sustained positive territory is the accumulation backdrop, sustained negative the distribution one.
- 3Weight the slope: a rising line below zero (flow repairing) and a falling line above zero (flow eroding) are the transitional reads between regimes.
- 4Check divergences at price extremes: new price highs unmatched by the flow line are the volume-support warning, steadier here than on unfiltered ancestors.
- 5Expect lag by design: the long window and filtering mean crosses and turns confirm rather than anticipate, so pair the read with faster price evidence.
- 6Audit the volume feed before trusting details: the line's claims are only as good as the venue's reported volume.
How traders use it
- As a slow trend filter: VFI above zero supports a long bias and below zero a short bias, with the zero-line cross treated as a regime change rather than a precise entry.
- For divergence: price making new highs while VFI fails to follow suggests the advance lacks volume support, the same read as OBV divergence but with the noise filtering built in.
- As confirmation alongside price signals: taking breakouts or moving-average crosses only when VFI agrees, on the view that volume flow should back the move; agreement adds conviction, not certainty.
- In agreement stacks: pairing VFI with a differently built flow gauge such as the Money Flow Index covers both cumulative-filtered and bounded-ratio constructions, with disagreement flagging that the volume story is ambiguous.
- At investment horizons: the long default window makes weekly-chart VFI a slow accumulation/distribution dial for position traders, a role its published parameterization was explicitly aimed at.
VFI vs other volume-flow tools
OBV: OBV commits every bar's full volume on any close change and accumulates forever; VFI signs by typical-price change, ignores sub-threshold moves, caps outliers, and sums over a window. OBV is the raw nerve, VFI the filtered instrument, faster versus steadier.
Money Flow Index: MFI compresses typical-price volume flow into a bounded 0-100 ratio read against overbought/oversold bands. VFI stays unbounded around zero and is read for regime and divergence; the two encode similar raw material into different grammars.
Volume Delta: Delta measures actual buyer-versus-seller aggression from executed trades, tick by tick. VFI infers direction from bar anatomy and filters it statistically, computable on any chart but blind to the intrabar auction that delta records directly.
Concept family
Volume & Order Flow
88 concepts mapped · 88 in the Library
Volume Flow Indicator FAQ
Turn Volume Flow Indicator into a trading strategy.
Take the implementation from this page into Quant, then build on it, backtest it on real data, and keep refining it in conversation.