Concept
Rotation Factor
Rotation Factor is a Volume & Order Flow concept. The Library holds 1 implementation, a working definition you can pull into Quant.
Top Rotation Factor indicator
The top custom implementation, built on the original standard Rotation Factor formula.
1 total
Want to trade Rotation Factor? The implementation below is one prompt away from a backtested strategy in Quant.
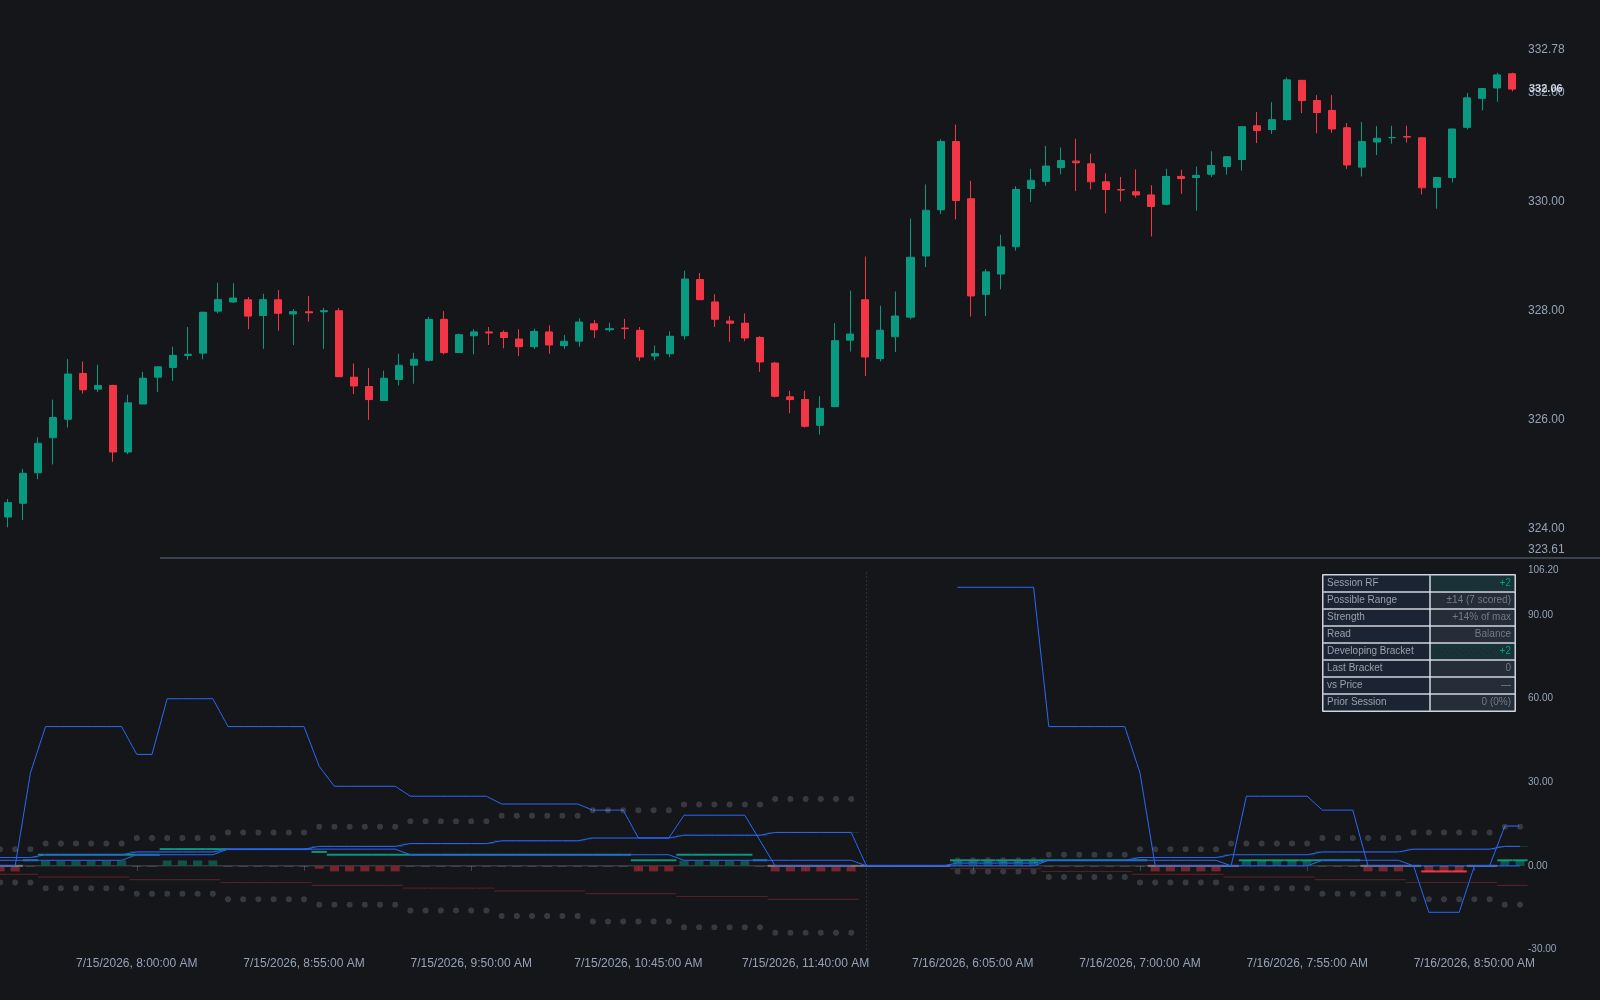
What is the Rotation Factor?
The rotation factor is a day-timeframe statistic from Market Profile, the auction framework J. Peter Steidlmayer developed at the Chicago Board of Trade. It scores how each intraday period rotated against the one before it. In the common construction, every TPO bracket (usually 30 minutes) is compared with the prior bracket: a higher high scores +1 and a lower high -1, a higher low scores +1 and a lower low -1, and unchanged extremes score 0. Each bracket therefore contributes between -2 and +2, and the session total is the day's rotation factor.
Market Profile organizes the session into lettered brackets, and the rotation factor is one of its original day-timeframe statistics, spread mainly through James Dalton's Mind Over Markets, the reference text that systematized much of profile practice. Its appeal is arithmetic honesty: no smoothing, no parameters beyond the bracket size, just a tally a trader can keep by hand from the developing profile. That simplicity dates to the pit era, when a pressure gauge needing no volume feed was genuinely valuable.
The count quantifies attempted direction: a strongly positive total says buyers controlled most of the period-by-period auctions, a strongly negative one says sellers did, and a total near zero reads as balance. Because it only tallies attempts, profile traders judge it against what price actually achieved on the TPO profile: persistent positive rotations with no upward progress are a classic effort-versus-result warning that responsive sellers are absorbing.
Modern order-flow tools ask the same question from different raw material, which makes them natural cross-checks. Volume delta counts traded aggression at the bid and ask, the volume profile shows where the session's business actually concentrated, and migration of the point of control tracks where value is being accepted. When the rotation count and the volume-based reads agree, the directional story is coherent; when they split, most traders downgrade the count, since bracket extremes are easier to push than real volume.
How to calculate the rotation factor on a chart
The statistic needs nothing but a session divided into fixed periods, thirty-minute brackets on most profile charts.
- 1Split the session into its TPO brackets and take the first bracket as the baseline; it receives no score.
- 2For each later bracket, compare highs with the bracket before: a higher high scores +1, a lower high -1, an unchanged high 0.
- 3Score lows the same way (+1 higher, -1 lower, 0 unchanged), giving every bracket a combined score between -2 and +2.
- 4Keep a running sum through the session; the closing total is the day's rotation factor.
- 5Read the total against the developing profile: check whether the count's direction is matched by range extension and by migration of the value area, not just by probing extremes.
How traders use it
- As a control gauge for the session: a count that builds steadily in one direction supports trading with the rotations, while a mixed reading near zero argues for two-sided, rotational tactics rather than trend-following.
- As a confirmation filter: strong rotation plus actual range extension supports continuation ideas, whereas strong rotation without range extension hints the attempted direction is being absorbed and may fail.
- As a divergence tell against price: when the rotation factor and the direction of value disagree, many profile traders stand aside or lean responsive, since the count says nothing about follow-through.
- As an order-flow cross-check: lining the count up with a delta profile separates price-led rotation from volume-backed rotation; upward rotations printed on persistent selling delta warn that probes higher are being sold into.
- As a session-type input: steadily one-sided counts fit trend-day tactics, while counts oscillating near zero fit responsive trade around the edges of balance, with price's side of the session VWAP as a companion reference.
Rotation Factor vs other pressure gauges
TPO Profile: The profile is the structure and the rotation factor a statistic computed from it: TPOs show where time accumulated at price, while the count compresses bracket-to-bracket direction into a single number. Profile traders read them together, structure first.
Volume Delta: Both score buying against selling from different raw material. Delta needs tick data and counts volume trading at the ask versus the bid; the rotation factor needs only bracket highs and lows. Delta measures executed aggression, the count measures attempted direction.
OBV: OBV accumulates volume by the sign of each close-to-close change, runs continuously across sessions, and has no natural bound. The rotation factor ignores volume, is bounded by the session's bracket count, and resets daily, a day-timeframe tool by construction.
Concept family
Volume & Order Flow
88 concepts mapped · 88 in the Library
Rotation Factor FAQ
Turn Rotation Factor into a trading strategy.
Take the implementation from this page into Quant, then build on it, backtest it on real data, and keep refining it in conversation.