Concept
Twiggs Money Flow
Twiggs Money Flow, also known as Twiggs studies: Momentum, Trend Index, Volatility, is a Volume & Order Flow concept. The Library holds 1 implementation, a working definition you can pull into Quant.
Top Twiggs Money Flow indicator
The top custom implementation, built on the original standard Twiggs Money Flow formula.
1 total
From studying Twiggs Money Flow to trading it: take the implementation below into Quant and backtest it instantly.
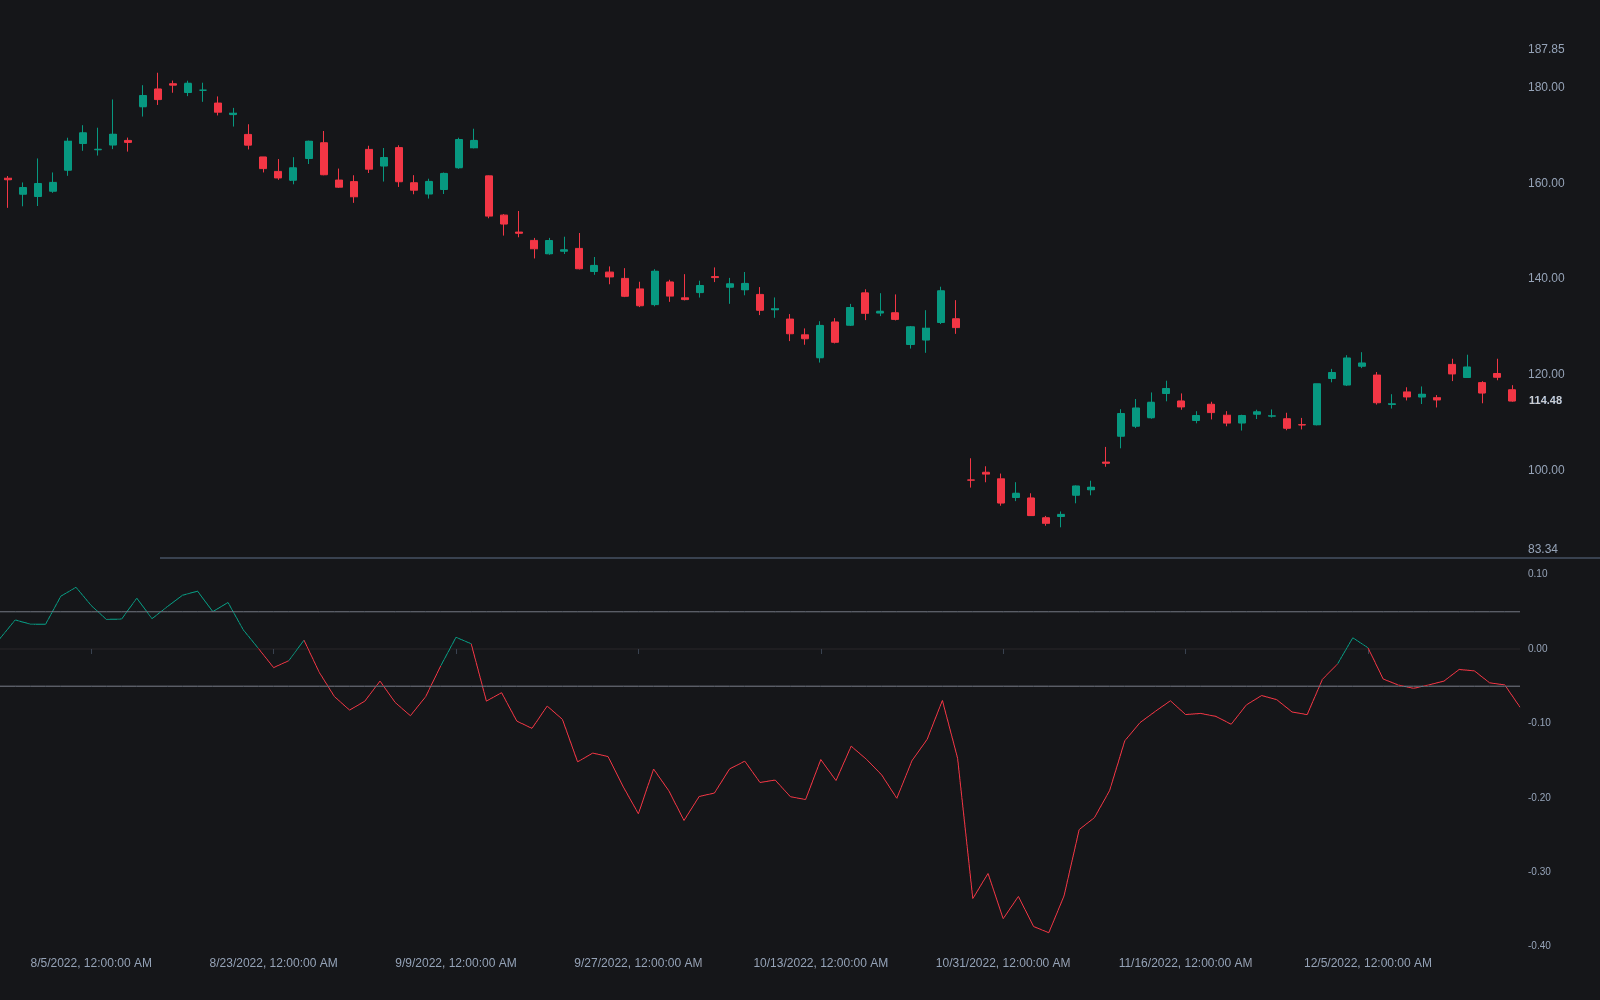
What is Twiggs Money Flow?
Twiggs Money Flow (TMF) is Colin Twiggs' refinement of Chaikin Money Flow, which itself builds on the close-location logic of the Accumulation/Distribution Line. Each bar's volume is signed by where the close sits inside the true range (true high is the greater of the bar's high and the prior close; true low is the lesser of the bar's low and the prior close): a close at the true high counts the full volume as buying pressure, at the true low as selling pressure, and at the midpoint as zero net flow.
TMF is that signed volume, exponentially smoothed, divided by smoothed total volume, commonly over 21 periods, so it oscillates around zero and is bounded between -1 and +1. Sustained positive readings indicate accumulation, sustained negative readings distribution, and the zero line is the practical bull/bear divide. Using true range makes it gap-aware: a gap down that closes weak registers almost entirely as selling pressure instead of slipping through the formula, one of the two weaknesses (with lumpy rolling sums) the design set out to fix.
The study comes from Colin Twiggs, whose Incredible Charts platform and newsletter popularized it as a longer-horizon replacement for Chaikin Money Flow. Reading it is deliberately simple: the zero line divides accumulation from distribution, and conviction comes from persistence rather than level. A common approach waits for the line to hold one side of zero for several bars, or beyond a small band such as plus or minus 0.05, before treating the state as changed; brief pokes across zero on a 21-period smoothing rarely mean anything. Because the output is a bounded ratio, readings are comparable across symbols, which is why the study also gets used to rank a watchlist by flow rather than only to read a single chart.
Its verdicts are only as good as the volume feed beneath them. Spot forex has no centralized volume, so TMF there runs on tick counts; crypto volume differs exchange to exchange; and thin instruments produce a line dominated by a handful of prints. The exponential smoothing that makes the study calm also makes it late, so a sharp distribution day bends the line rather than breaking it. And like every flow proxy built from bar shape, it infers pressure from where candles close instead of measuring who initiated trades, an inference that intrabar volume delta data can contradict.
How to identify accumulation and distribution with Twiggs Money Flow
TMF plots as a single bounded line around zero in a subpanel. The reads that matter are the side of zero, how long it has held, and disagreements with price at new extremes.
- 1Apply the study with its common 21-period smoothing on a market with trustworthy volume; on spot forex or thin issues, treat the line as a tick-activity sketch rather than a flow measure.
- 2Read the regime from the zero line: sustained positive values indicate closes concentrating high in their true ranges on volume, the accumulation signature; sustained negative values the reverse.
- 3Ignore brief zero crosses: require several bars on the new side, or a push beyond a small threshold, before calling a state change; the smoothing makes single-bar flips unreliable.
- 4Mark volume divergence at fresh price extremes: new highs with TMF fading toward zero warn that the advance is being sold into, a warning that fails often enough to demand structural confirmation.
- 5Cross-check event bars with relative volume: a breakout that TMF supports on ordinary participation is a weaker claim than one arriving with genuinely elevated volume.
How it's calculated
A bounded flow oscillator that signs each bar's volume by where the close sits inside the true range, then divides smoothed signed volume by smoothed total volume.
Colin Twiggs designed TMF as a gap-aware replacement for Chaikin Money Flow: true range stands in for the raw high-low range and exponential smoothing replaces rolling sums.
The smoothing above uses alpha = 1/n (Wilder style, per the published definition); ports using a standard EMA with alpha = 2/(n+1) respond faster and print slightly different values.
Readings above zero indicate net accumulation and below zero net distribution; Twiggs' related Momentum, Trend Index and Volatility studies reuse the smoothing style but are separate calculations.
How traders use it
- As a trend-quality filter: holding longs only while TMF stays above zero (or a small positive threshold) keeps exposure aligned with net accumulation; the crossing itself is slow by design and will lag sharp turns.
- As divergence context: price printing new highs while TMF fades toward zero suggests the advance is being sold into, the same read applied to OBV and other flow lines, and just as fallible.
- As an independent cross-check: because TMF weights volume by close location within true range, it can disagree with a bounded oscillator like the Money Flow Index; agreement between the two is a stronger accumulation or distribution claim than either alone.
- As breakout vetting: a resistance break with TMF positive and rising is backed by accumulation in the run-up, complementing the bar-level read of volume at breakout; a break attempted while the line sags is suspect.
- As a watchlist screen: because the reading is bounded, sorting a universe of symbols by TMF surfaces those under persistent accumulation or distribution, a comparative use that unbounded cumulative lines cannot serve without extra normalization.
Twiggs Money Flow vs other flow gauges
OBV: OBV adds or subtracts each bar's entire volume on the close's direction and accumulates forever, so its level is path-dependent and only its shape matters. TMF weights volume by close location within true range and stays bounded, making the level itself meaningful and comparable across symbols.
Money Flow Index: MFI is a bounded 0-100 oscillator built from typical price and volume over a rolling window, read like a volume-weighted RSI with overbought and oversold zones. TMF centers on zero and moves slower; it describes regime rather than stretch.
Volume Delta: Delta measures aggression directly, classifying each trade by whether it hit the bid or lifted the offer. TMF infers pressure from where bars close. Delta is the finer instrument where tick data exists; TMF runs on any OHLCV feed and holds up on higher timeframes.
Concept family
Volume & Order Flow
88 concepts mapped · 88 in the Library
Twiggs Money Flow FAQ
Turn Twiggs Money Flow into a trading strategy.
Take the implementation from this page into Quant, then build on it, backtest it on real data, and keep refining it in conversation.