Concept
Force Index
Force Index is a Volume & Order Flow concept. The Library holds 1 implementation, a working definition you can pull into Quant.
Elder
The standard Force Index indicator
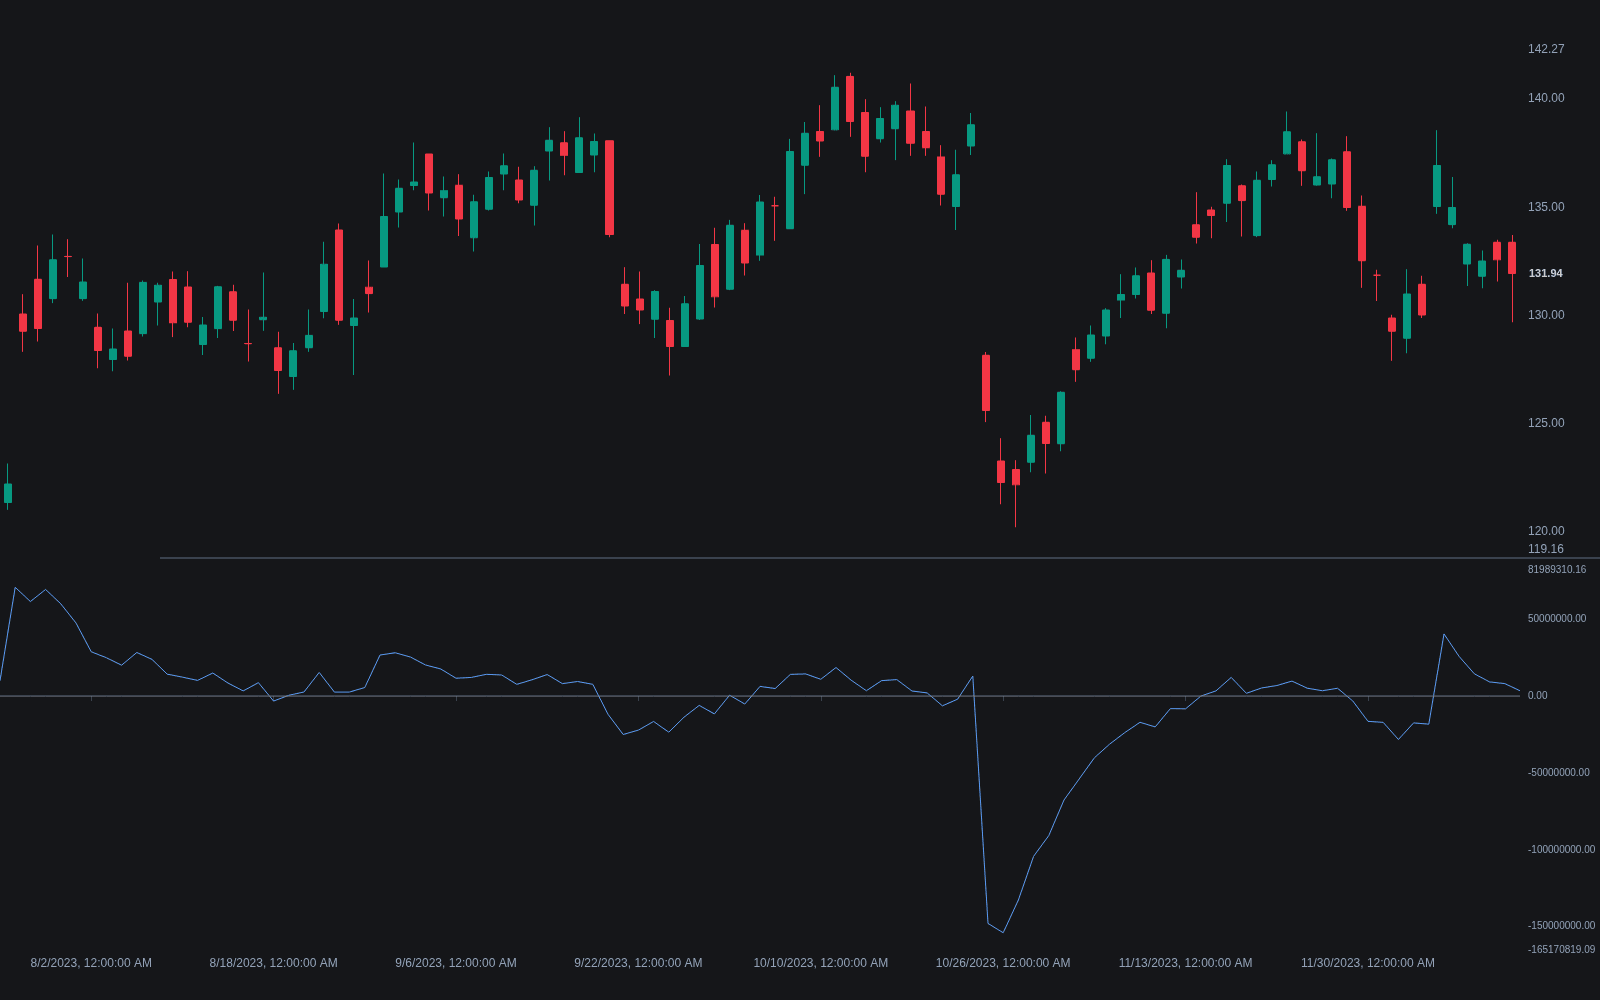
Force Index exactly as classically defined: the faithful reference build of the original formula, free to run in Quant.
What is the Force Index?
The Force Index is Alexander Elder's volume-weighted momentum measure, introduced in his 1993 book Trading for a Living. Each bar's raw value is the change in close from the prior bar multiplied by volume, so one number captures direction, the size of the move, and the participation behind it. A strong advance on heavy volume prints a large positive value; a drift on thin volume barely registers.
The raw series is too jagged to read, so Elder smoothed it with an EMA: a 2-period EMA for short-term entry timing and a 13-period EMA for tracking intermediate-term buying and selling pressure. Readings above zero say bulls dominated recent bars, readings below zero say bears did, and zero-line crosses and divergences against price are the standard signals.
The design's insight is multiplicative: direction alone (the sign), distance alone (the change), and participation alone (the volume) each mislead in isolation, and multiplying them means a bar only prints force when all three agree it should. That is also the construction's known bias, since one news bar combining a large move with climactic volume can dominate weeks of the series, which the smoothing dampens but cannot erase. The two published lengths divide the labor deliberately: the 2-period EMA is a hair-trigger gauge of the last few bars' pressure, built to find pauses inside trends, while the 13-period line tracks the swing-scale balance of power.
Within Elder's own framework the Force Index is a second-screen tool: the triple-screen method sets direction on a higher timeframe, then uses the short Force Index dipping against that direction as the entry timer, which is why the 2-period version's whipsaw is a feature in context and a menace standalone. The lineage continues in modern derivatives, directional-energy ratios and volume-accelerated momentum studies that refine the same price-change-times-volume core, and in hybrid uses where force readings color or filter other systems. The usual volume caveats apply wherever the volume leg is proxy or fragmented.
How to identify Force Index readings
One multiplication, two smoothings, and a division of labor between them.
- 1Compute the raw value per bar: the close-to-close change multiplied by the bar's volume.
- 2Smooth twice, separately: a 2-period EMA for the short-term pressure gauge, a 13-period EMA for the intermediate balance.
- 3Read the zero line: above, bulls have supplied the recent force; below, bears; crosses mark the handoff.
- 4Use each length for its job: the 2-period line finds pauses inside trends, the 13-period line tracks swing-scale pressure and prints the divergences worth acting on.
- 5Weigh extremes against the series' own history: a multi-week record in force behind a move is conviction, while an unremarkable reading behind a breakout is the warning.
How it's calculated
An oscillator that measures the pressure behind each bar as the product of price change and volume.
Published by Alexander Elder in Trading for a Living (1993).
Elder used the 2 period EMA for short term timing and the 13 period EMA for the intermediate trend; the raw 1 bar series is rarely plotted on its own.
The oscillator is unbounded and scales with the instrument's volume, so absolute values are not comparable across markets.
How traders use it
- Pullback entries within a trend: Elder's classic tactic buys when the 2-period Force Index dips below zero in an uptrend (a brief pause in buying pressure) and shorts pops above zero in a downtrend, with a separate trend filter deciding direction.
- Divergence: price printing a lower low while the 13-period Force Index makes a higher low signals fading selling force, a standard bullish divergence read that Elder emphasized.
- Breakout validation: a breakout accompanied by a multi-week extreme in the Force Index shows volume-backed conviction, while one on a modest reading earns more skepticism, the same question volume at breakout asks directly.
- Inside the triple-screen workflow: a higher-timeframe screen sets direction, and the short Force Index dipping against that direction supplies the entry timing, the role Elder designed the 2-period line to play.
- As a component in modern derivatives: directional-energy and volume-accelerated momentum studies refine the same core product of price change and volume, and force readings serve as background coloring or filters on unrelated systems.
Force Index vs related volume measures
OBV: OBV accumulates whole-bar volume by close direction into a running balance, ignoring move size entirely. The Force Index is per-bar and magnitude-weighted, oscillating around zero. OBV asks who has been winning overall; the Force Index asks how hard the last few bars were pushed.
Volume Delta: Delta splits each bar's actual tape by aggressor side, a microstructure measurement; the Force Index approximates pressure from the close change and total volume, a chart-level proxy. Delta is finer and needs tick data; force is coarser and computes anywhere.
Money Flow Index: MFI pushes volume-weighted typical price through RSI arithmetic into a bounded 0-100 oscillator with overbought and oversold conventions. The Force Index stays unbounded and centered on zero, trading level conventions for honest magnitude. Bounded rank versus raw push.
Concept family
Volume & Order Flow
88 concepts mapped · 88 in the Library
Force Index FAQ
Turn Force Index into a trading strategy.
Take the implementation from this page into Quant, then build on it, backtest it on real data, and keep refining it in conversation.