Concept
No-demand / No-supply Bars
No-demand / No-supply Bars are Volume & Order Flow concepts. The Library holds 1 implementation, a working definition you can pull into Quant.
Top No-demand / No-supply Bars indicator
The top custom implementation, built on the original standard No-demand / No-supply Bars formula.
1 total
The No-demand / No-supply Bars implementation below can become a backtested trading strategy — describe your rules and Quant writes the code.
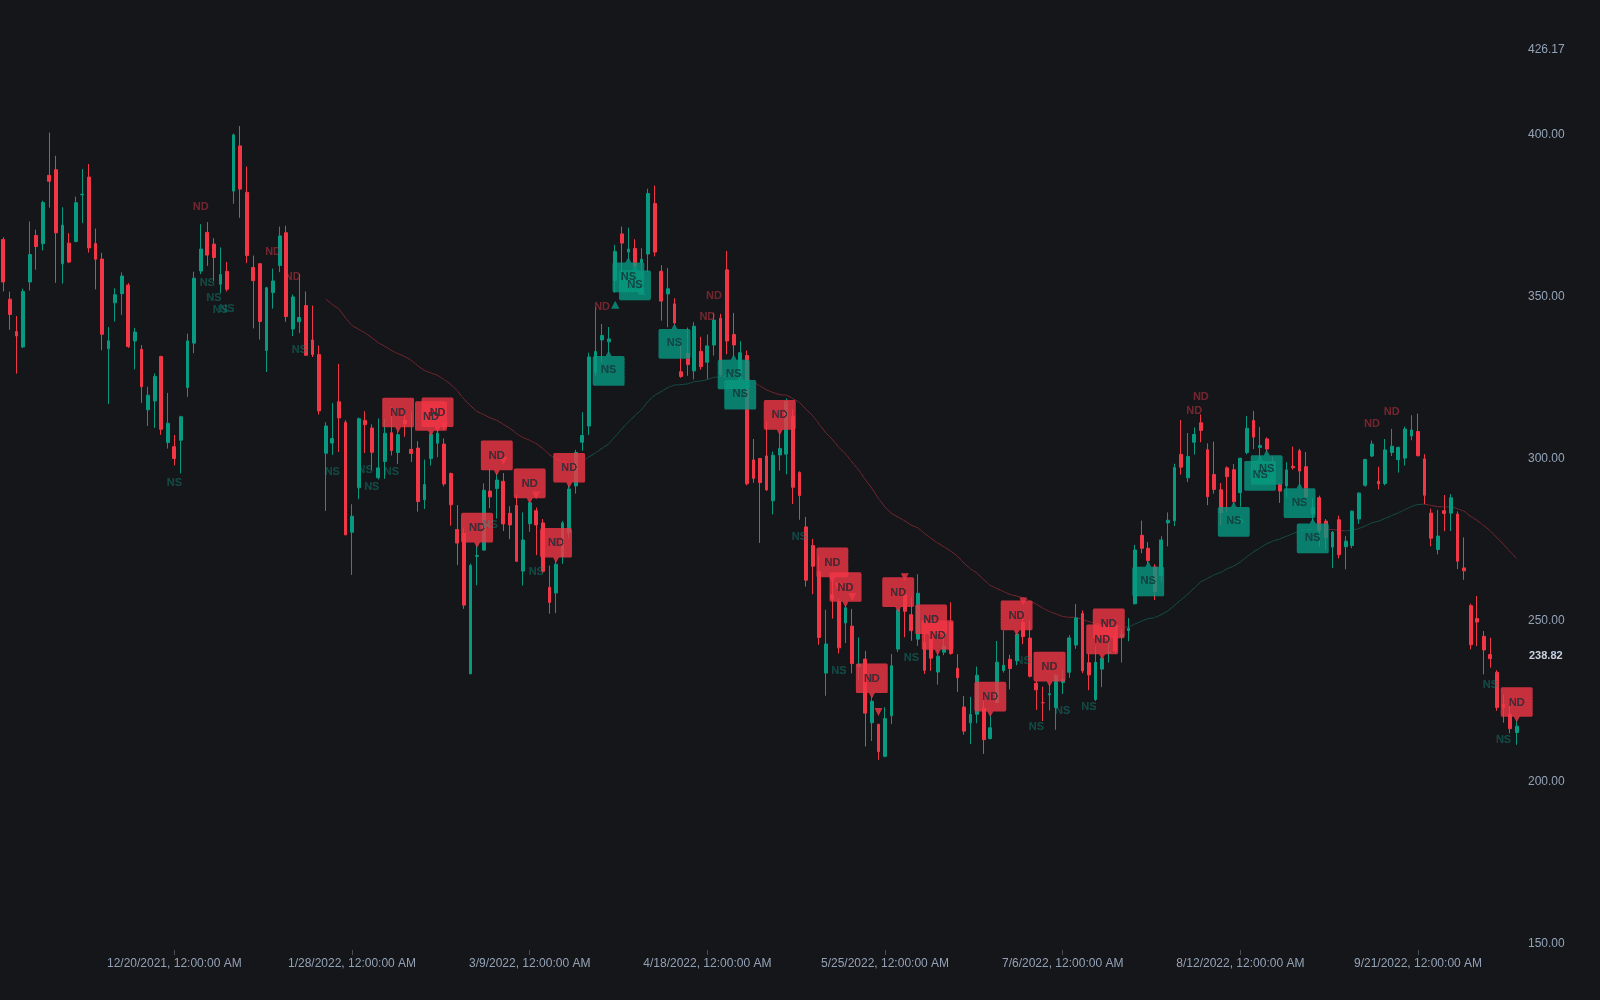
What are No-demand / No-supply Bars?
No-demand and no-supply bars are classifications from Volume Spread Analysis (VSA), the discipline Tom Williams developed out of Wyckoff's effort vs result logic. A no-demand bar is an up bar (close above the prior close) with a narrow spread and volume lower than each of the previous two bars: price rose, but no professional money chased it, so the rally is suspect. A no-supply bar is the mirror image: a down bar with a narrow spread on volume below the previous two bars, a dip with no real selling behind it.
Neither bar means anything on its own in VSA. They are read against the background: no-supply appearing after signs of strength is treated as a successful test that clears the way higher, while no-demand appearing after signs of weakness argues the upmove is a rally to sell into.
The lineage matters for reading them correctly. Williams, a former syndicate trader who systematized his approach in Master the Markets, framed every bar as a question about professional participation: the no-demand and no-supply labels are absence findings, the professionals declining to join a move, which is why the volume must sit below both prior bars rather than merely below average. They live inside a larger VSA taxonomy alongside stopping volume, tests, and upthrusts, and the discipline's core rule is that background analysis precedes bar reading: the same narrow, quiet bar is bullish evidence in an accumulating market and bearish evidence in a distributing one.
Modern practice keeps the logic and tightens the engineering. Detection tools like the Library's NSND study make the thresholds explicit parameters, narrowness relative to recent spreads, the two-bar volume comparison, optional background filters, so the classification is reproducible rather than eyeballed. Confirmation discipline is standard: the bar nominates a scenario and the next bar's close votes on it. And the input caveats are the volume family's usual ones: the inference assumes meaningful volume data, judged against a relative volume baseline, and modern order-flow tools can check directly, via volume delta, what VSA infers indirectly from spread and total volume.
How to identify no-demand and no-supply bars
Three mechanical checks and one contextual one, with the context carrying the meaning.
- 1Classify the close: above the prior close makes the candidate a no-demand bar, below it a no-supply bar.
- 2Require a narrow spread: the bar's high-to-low range visibly below recent bars, the low-effort signature.
- 3Require quiet volume: below each of the previous two bars, the absence test that separates these labels from ordinary pullback bars.
- 4Read the background first: the same bar is bullish after demonstrated strength and bearish after demonstrated weakness, and means little in a vacuum.
- 5Demand confirmation: the following bar's close in the expected direction is the conventional trigger, the quiet bar itself being evidence rather than entry.
How traders use it
- As continuation filters: in a market showing background strength, no-supply pullbacks are used to time longs; in background weakness, no-demand rallies are used to time shorts.
- As test confirmation: after stopping volume or a shakeout, a later no-supply bar suggests sellers are exhausted, with the next bar's close commonly required as confirmation.
- As a warning against chasing: a breakout attempt built on no-demand bars lacks the volume signature VSA expects from genuine markup.
- In automated screens: detector tools parameterize the spread and volume thresholds explicitly, so the bars are flagged consistently and the trader's judgment is reserved for the background call.
- Cross-checked with order flow: where delta data exists, a no-supply bar whose tape genuinely shows absent aggressive selling carries more weight than one inferred from totals alone.
NSND bars vs related volume reads
Effort vs Result: The Wyckoff law is the principle: volume spent should produce movement. The VSA bar labels are packaged verdicts under that law, no-demand and no-supply being the specific case of absent effort on a directional close, pre-classified for scanning.
Volume Spike: Opposite anomalies: the spike is effort arriving in excess, read for climax and absorption; the NSND bar is effort failing to arrive at all. VSA needs both, since campaigns announce themselves with volume and betray themselves with its absence.
Volume Delta: Delta measures aggressor balance directly from the tape; VSA infers participation from spread and total volume, a chart-level approximation of the same question. Where both exist, delta audits the inference, and their agreement is the stronger read.
Concept family
Volume & Order Flow
88 concepts mapped · 88 in the Library
No-demand / No-supply Bars FAQ
Turn No-demand / No-supply Bars into a trading strategy.
Take the implementation from this page into Quant, then build on it, backtest it on real data, and keep refining it in conversation.